
Statistical Reasoning for Everyday Life Plus MyLab Statistics with Pearson eText -- 18 Week Access Card Package (5th Edition)
5th Edition
ISBN: 9780135990278
Author: Bennett, Jeffrey O., Briggs, William L., Triola, Mario F.
Publisher: PEARSON
expand_more
expand_more
format_list_bulleted
Concept explainers
Videos
Textbook Question
Chapter 3.3, Problem 9E
Public and Private Colleges. The stack plot in Figure 3.20 shows the numbers of higher education students enrolled in public and private colleges. The last few bars are projections from the U.S. National Center for Education Statistics.
- a. Describe any trends revealed on this graphic.
- b. Redraw the graph as a multiple line chart. Briefly discuss the advantages and disadvantages of the two different representations of this particular data set.
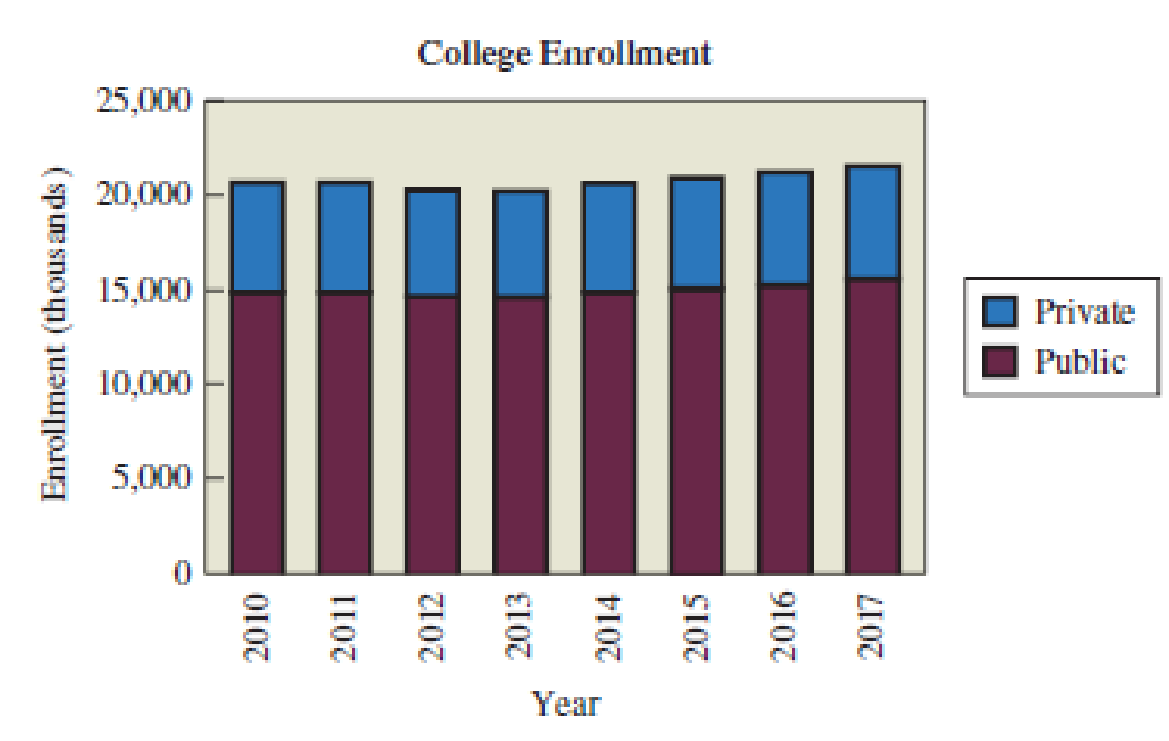
Figure 3.20 Source: National Center for Education Statistics.
Expert Solution & Answer
Want to see the full answer?
Check out a sample textbook solution
Students have asked these similar questions
A 24-1 design has been used to investigate the effect of four factors on the resistivity of a silicon wafer. The data
from this experiment are shown in Table 4.
Table 4: Resistivity Experiment for Exercise 5
Run
A
B
с
D
Resistivity
1
23
2
3
4
5
6
7
8
9
10
11
12
I+I+I+I+Oooo
0
0
||++TI++o000
33.2
4.6
31.2
9.6
40.6
162.4
39.4
158.6
63.4
62.6
58.7
0
0
60.9
3
(a) Estimate the factor effects. Plot the effect estimates on a normal probability scale.
(b) Identify a tentative model for this process. Fit the model and test for curvature.
(c) Plot the residuals from the model in part (b) versus the predicted resistivity. Is there any indication on
this plot of model inadequacy?
(d) Construct a normal probability plot of the residuals. Is there any reason to doubt the validity of the
normality assumption?
Stem1: 1,4
Stem 2: 2,4,8
Stem3: 2,4
Stem4: 0,1,6,8
Stem5: 0,1,2,3,9
Stem 6: 2,2
What’s the Min,Q1, Med,Q3,Max?
Are the t-statistics here greater than 1.96? What do you conclude?
colgPA= 1.39+0.412 hsGPA
(.33) (0.094)
Find the P value
Chapter 3 Solutions
Statistical Reasoning for Everyday Life Plus MyLab Statistics with Pearson eText -- 18 Week Access Card Package (5th Edition)
Ch. 3.1 - Frequency Table. What is a frequency table? How...Ch. 3.1 - Relative Frequency. What do we mean by relative...Ch. 3.1 - Cumulative Frequency. What do we mean by...Ch. 3.1 - Binning. What is the purpose of binning? Give an...Ch. 3.1 - Does It Make Sense? For Exercises 58, determine...Ch. 3.1 - Does It Make Sense? For Exercises 58, determine...Ch. 3.1 - Does It Make Sense? For Exercises 58, determine...Ch. 3.1 - Does It Make Sense? For Exercises 58, determine...Ch. 3.1 - Pulse Rates of Females. In Exercises 912, refer to...Ch. 3.1 - Pulse Rates of Females. In Exercises 912, refer to...
Ch. 3.1 - Pulse Rates of Females. In Exercises 912, refer to...Ch. 3.1 - Pulse Rates of Females. In Exercises 912, refer to...Ch. 3.1 - Birth Days. Births at a hospital in New York State...Ch. 3.1 - Clinical Trial. As part of a clinical trial, the...Ch. 3.1 - Train Derailments. An analysis of 50 train...Ch. 3.1 - Analysis of Last Digits. Weights of respondents...Ch. 3.1 - Academy Award-Winning Male Actors. The following...Ch. 3.1 - Body Temperatures. The following data show the...Ch. 3.1 - Loaded Die. An experiment was conducted in which a...Ch. 3.1 - Interpreting Family Data. Consider the following...Ch. 3.1 - Computer Keyboards. The traditional keyboard...Ch. 3.1 - Double Binning. The students in a statistics class...Ch. 3.2 - Distribution Graph. What is a distribution of...Ch. 3.2 - Qualitative Data. Which types of graph described...Ch. 3.2 - Yearly Data. Which type of graph described in this...Ch. 3.2 - Histogram and Stemplot. Assume that a data set is...Ch. 3.2 - Prob. 5ECh. 3.2 - Does It Make Sense? For Exercises 58, determine...Ch. 3.2 - Does It Make Sense? For Exercises 58, determine...Ch. 3.2 - Does It Make Sense? For Exercises 58, determine...Ch. 3.2 - Histogram. Children living near a smelter in Texas...Ch. 3.2 - Understanding Data. Suppose you have a list of...Ch. 3.2 - Most Appropriate Display. Exercises 1114 describe...Ch. 3.2 - Most Appropriate Display. Exercises 1114 describe...Ch. 3.2 - Most Appropriate Display. Exercises 1114 describe...Ch. 3.2 - Most Appropriate Display. Exercises 1114 describe...Ch. 3.2 - Academy Award-Winning Male Actors. Exercise 17 in...Ch. 3.2 - Body Temperatures. Exercise 18 in Section 3.1...Ch. 3.2 - Job Hunting. A survey was conducted to determine...Ch. 3.2 - Job Hunting. Refer to the data given in Exercise...Ch. 3.2 - Prob. 19ECh. 3.2 - Job Application Mistakes Construct a Pareto chart...Ch. 3.2 - Dotplot. Refer to the QWERTY data in Exercise 21...Ch. 3.2 - Dotplot. Refer to the Dvorak data in Exercise 21...Ch. 3.2 - Stemplot. Construct a stemplot of these test...Ch. 3.2 - Stemplot. Listed below are the lengths (in...Ch. 3.2 - DJIA. Listed below (in order by row) are annual...Ch. 3.2 - Home Runs. Listed below (in order by row) are the...Ch. 3.3 - Multiple Data. Briefly describe how each of the...Ch. 3.3 - Prob. 2ECh. 3.3 - Prob. 3ECh. 3.3 - Prob. 4ECh. 3.3 - Does It Make Sense? For Exercises 58, determine...Ch. 3.3 - Does It Make Sense? For Exercises 58, determine...Ch. 3.3 - Does It Make Sense? For Exercises 58, determine...Ch. 3.3 - Does It Make Sense? For Exercises 58, determine...Ch. 3.3 - Public and Private Colleges. The stack plot in...Ch. 3.3 - Home Prices by Region. The graph in Figure 3.21...Ch. 3.3 - Gender and Salary. Consider the display in Figure...Ch. 3.3 - Marriage and Divorce Rates. The graph in Figure...Ch. 3.3 - Prob. 13ECh. 3.3 - College Degrees. The stack plot in Figure 3.25...Ch. 3.3 - Contour Map. For Exercises 17 and 18, refer to the...Ch. 3.3 - Prob. 18ECh. 3.3 - Prob. 19ECh. 3.3 - Prob. 20ECh. 3.3 - Infographic. For Exercises 21 and 22, refer to...Ch. 3.3 - Infographic. For Exercises 21 and 22, refer to...Ch. 3.3 - Creating Graphics. Exercises 2326 give tables of...Ch. 3.3 - Creating Graphics. Exercises 2326 give tables of...Ch. 3.3 - Firearms Fatalities. The following table...Ch. 3.3 - Prob. 26ECh. 3.4 - Perceptual Distortion. Use a ruler to measure the...Ch. 3.4 - Prob. 2ECh. 3.4 - Prob. 3ECh. 3.4 - Prob. 4ECh. 3.4 - Does It Make Sense? For Exercises 58, determine...Ch. 3.4 - Does It Make Sense? For Exercises 58, determine...Ch. 3.4 - Does It Make Sense? For Exercises 58, determine...Ch. 3.4 - Does It Make Sense? For Exercises 58, determine...Ch. 3.4 - Exaggerating a Difference. Weekly instruction time...Ch. 3.4 - Graph of Sounds. In a survey conducted by Kelton...Ch. 3.4 - Graph Dimensions. A newspaper used images of...Ch. 3.4 - Prob. 12ECh. 3.4 - Prob. 13ECh. 3.4 - DJIA. Figure 3.36 on the next page depicts the...Ch. 3.4 - Prob. 15ECh. 3.4 - Prob. 16ECh. 3.4 - Prob. 17ECh. 3.4 - Moores Law. In 1965, Intel cofounder Gordon Moore...Ch. 3.4 - Prob. 19ECh. 3.4 - Prob. 20ECh. 3.4 - Constant Dollars. The graph in Figure 3.41 shows...Ch. 3.4 - Prob. 22ECh. 3 - Listed below are measured weights (in pounds) of...Ch. 3 - Listed below are measured weights (in pounds) of...Ch. 3 - Listed below are measured weights (in pounds) of...Ch. 3 - Pie Chart for Sports Equipment. USA Today reported...Ch. 3 - Pareto Chart for Sports Equipment. Construct a...Ch. 3 - Bar Chart. Figure 3.43 shows the numbers of U.S....Ch. 3 - As a quality control manager at Ford Motor...Ch. 3 - As a quality control manager at Ford, you monitor...Ch. 3 - A stemplot is created with the braking distances...Ch. 3 - A dotplot of braking distances (in feet) of cars...Ch. 3 - The first category in a frequency table is 90100,...Ch. 3 - The first category in a relative frequency table...Ch. 3 - The third category in a frequency table has a...Ch. 3 - Prob. 8CQCh. 3 - When constructing a graph of the same categorical...Ch. 3 - Body Temperatures Listed below are body...Ch. 3 - Why are pictographs generally poor for depicting...Ch. 3 - Note that this graph plots six variables: two...Ch. 3 - Prob. 2.2FCh. 3 - Prob. 2.3F
Additional Math Textbook Solutions
Find more solutions based on key concepts
1. How is a sample related to a population?
Elementary Statistics: Picturing the World (7th Edition)
Empirical versus Theoretical A Monopoly player claims that the probability of getting a 4 when rolling a six-si...
Introductory Statistics
True or False The quotient of two polynomial expressions is a rational expression, (p. A35)
Precalculus
Reading, Writing, and Rounding Whole Numbers Write in words. 357
Mathematics for the Trades: A Guided Approach (11th Edition) (What's New in Trade Math)
(a) Make a stem-and-leaf plot for these 24 observations on the number of customers who used a down-town CitiBan...
APPLIED STAT.IN BUS.+ECONOMICS
Find all solutions of each equation in the interval .
Precalculus: A Unit Circle Approach (3rd Edition)
Knowledge Booster


Learn more about
Need a deep-dive on the concept behind this application? Look no further. Learn more about this topic, statistics and related others by exploring similar questions and additional content below.Similar questions
- A poll before the elections showed that in a given sample 79% of people vote for candidate C. How many people should be interviewed so that the pollsters can be 99% sure that from 75% to 83% of the population will vote for candidate C? Round your answer to the whole number.arrow_forwardSuppose a random sample of 459 married couples found that 307 had two or more personality preferences in common. In another random sample of 471 married couples, it was found that only 31 had no preferences in common. Let p1 be the population proportion of all married couples who have two or more personality preferences in common. Let p2 be the population proportion of all married couples who have no personality preferences in common. Find a95% confidence interval for . Round your answer to three decimal places.arrow_forwardA history teacher interviewed a random sample of 80 students about their preferences in learning activities outside of school and whether they are considering watching a historical movie at the cinema. 69 answered that they would like to go to the cinema. Let p represent the proportion of students who want to watch a historical movie. Determine the maximal margin of error. Use α = 0.05. Round your answer to three decimal places. arrow_forward
- A random sample of medical files is used to estimate the proportion p of all people who have blood type B. If you have no preliminary estimate for p, how many medical files should you include in a random sample in order to be 99% sure that the point estimate will be within a distance of 0.07 from p? Round your answer to the next higher whole number.arrow_forwardA clinical study is designed to assess the average length of hospital stay of patients who underwent surgery. A preliminary study of a random sample of 70 surgery patients’ records showed that the standard deviation of the lengths of stay of all surgery patients is 7.5 days. How large should a sample to estimate the desired mean to within 1 day at 95% confidence? Round your answer to the whole number.arrow_forwardA clinical study is designed to assess the average length of hospital stay of patients who underwent surgery. A preliminary study of a random sample of 70 surgery patients’ records showed that the standard deviation of the lengths of stay of all surgery patients is 7.5 days. How large should a sample to estimate the desired mean to within 1 day at 95% confidence? Round your answer to the whole number.arrow_forward
- In the experiment a sample of subjects is drawn of people who have an elbow surgery. Each of the people included in the sample was interviewed about their health status and measurements were taken before and after surgery. Are the measurements before and after the operation independent or dependent samples?arrow_forwardiid 1. The CLT provides an approximate sampling distribution for the arithmetic average Ỹ of a random sample Y₁, . . ., Yn f(y). The parameters of the approximate sampling distribution depend on the mean and variance of the underlying random variables (i.e., the population mean and variance). The approximation can be written to emphasize this, using the expec- tation and variance of one of the random variables in the sample instead of the parameters μ, 02: YNEY, · (1 (EY,, varyi n For the following population distributions f, write the approximate distribution of the sample mean. (a) Exponential with rate ẞ: f(y) = ß exp{−ßy} 1 (b) Chi-square with degrees of freedom: f(y) = ( 4 ) 2 y = exp { — ½/ } г( (c) Poisson with rate λ: P(Y = y) = exp(-\} > y! y²arrow_forward2. Let Y₁,……., Y be a random sample with common mean μ and common variance σ². Use the CLT to write an expression approximating the CDF P(Ỹ ≤ x) in terms of µ, σ² and n, and the standard normal CDF Fz(·).arrow_forward
- matharrow_forwardCompute the median of the following data. 32, 41, 36, 42, 29, 30, 40, 22, 25, 37arrow_forwardTask Description: Read the following case study and answer the questions that follow. Ella is a 9-year-old third-grade student in an inclusive classroom. She has been diagnosed with Emotional and Behavioural Disorder (EBD). She has been struggling academically and socially due to challenges related to self-regulation, impulsivity, and emotional outbursts. Ella's behaviour includes frequent tantrums, defiance toward authority figures, and difficulty forming positive relationships with peers. Despite her challenges, Ella shows an interest in art and creative activities and demonstrates strong verbal skills when calm. Describe 2 strategies that could be implemented that could help Ella regulate her emotions in class (4 marks) Explain 2 strategies that could improve Ella’s social skills (4 marks) Identify 2 accommodations that could be implemented to support Ella academic progress and provide a rationale for your recommendation.(6 marks) Provide a detailed explanation of 2 ways…arrow_forward
arrow_back_ios
SEE MORE QUESTIONS
arrow_forward_ios
Recommended textbooks for you
 Glencoe Algebra 1, Student Edition, 9780079039897...AlgebraISBN:9780079039897Author:CarterPublisher:McGraw Hill
 Holt Mcdougal Larson Pre-algebra: Student Edition...AlgebraISBN:9780547587776Author:HOLT MCDOUGALPublisher:HOLT MCDOUGAL
 Big Ideas Math A Bridge To Success Algebra 1: Stu...AlgebraISBN:9781680331141Author:HOUGHTON MIFFLIN HARCOURTPublisher:Houghton Mifflin Harcourt
 Functions and Change: A Modeling Approach to Coll...AlgebraISBN:9781337111348Author:Bruce Crauder, Benny Evans, Alan NoellPublisher:Cengage Learning
Glencoe Algebra 1, Student Edition, 9780079039897...
Algebra
ISBN:9780079039897
Author:Carter
Publisher:McGraw Hill
Holt Mcdougal Larson Pre-algebra: Student Edition...
Algebra
ISBN:9780547587776
Author:HOLT MCDOUGAL
Publisher:HOLT MCDOUGAL
Big Ideas Math A Bridge To Success Algebra 1: Stu...
Algebra
ISBN:9781680331141
Author:HOUGHTON MIFFLIN HARCOURT
Publisher:Houghton Mifflin Harcourt
Functions and Change: A Modeling Approach to Coll...
Algebra
ISBN:9781337111348
Author:Bruce Crauder, Benny Evans, Alan Noell
Publisher:Cengage Learning
Types of Data: Nominal, Ordinal, Interval/Ratio - Statistics Help; Author: Dr Nic's Maths and Stats;https://www.youtube.com/watch?v=hZxnzfnt5v8;License: Standard YouTube License, CC-BY
Statistics 1.1.2 Types of Data; Author: Dr. Jack L. Jackson II;https://www.youtube.com/watch?v=UZ4kHJOuoec;License: Standard YouTube License, CC-BY