
Statistical Reasoning for Everyday Life Plus MyLab Statistics with Pearson eText -- 18 Week Access Card Package (5th Edition)
5th Edition
ISBN: 9780135990278
Author: Bennett, Jeffrey O., Briggs, William L., Triola, Mario F.
Publisher: PEARSON
expand_more
expand_more
format_list_bulleted
Concept explainers
Videos
Textbook Question
Chapter 3.2, Problem 18E
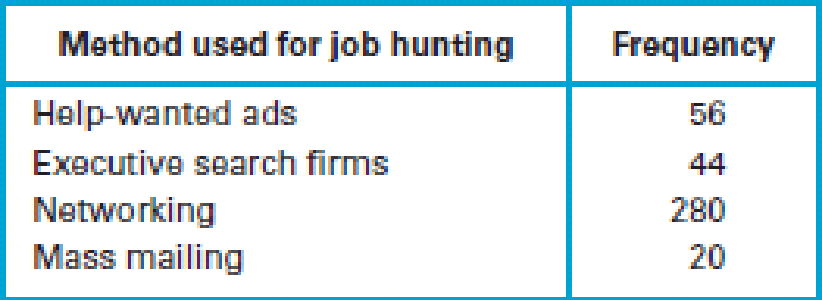
Job Hunting. Refer to the data given in Exercise 17, and construct a pie chart. Compare the pie chart to the Pareto chart. Can you determine which graph is more effective in showing the relative usefulness of the job–hunting methods?
- 17. Job Hunting. A survey was conducted to determine how employees found their jobs. The table below lists the successful methods identified by 400 randomly selected employees. The data are based on results from the National Center for Career Strategies. Construct a Pareto chart that displays the given data. Based on these results, what appears to be the best method for someone seeking employment?
Expert Solution & Answer
Want to see the full answer?
Check out a sample textbook solution
Students have asked these similar questions
Q.2.4 There are twelve (12) teams participating in a pub quiz. What is the probability of correctly predicting the top three teams at the end of the competition, in the correct order? Give your final answer as a fraction in its simplest form.
The table below indicates the number of years of experience of a sample of employees who work on a particular production line and the corresponding number of units of a good that each employee produced last month.
Years of Experience (x)
Number of Goods (y)
11
63
5
57
1
48
4
54
5
45
3
51
Q.1.1 By completing the table below and then applying the relevant formulae, determine the line of best fit for this bivariate data set.
Do NOT change the units for the variables.
X
y
X2
xy
Ex=
Ey=
EX2
EXY=
Q.1.2 Estimate the number of units of the good that would have been produced last month by an employee with 8 years of experience.
Q.1.3 Using your calculator, determine the coefficient of correlation for the data set.
Interpret your answer.
Q.1.4 Compute the coefficient of determination for the data set.
Interpret your answer.
Can you answer this question for me
Chapter 3 Solutions
Statistical Reasoning for Everyday Life Plus MyLab Statistics with Pearson eText -- 18 Week Access Card Package (5th Edition)
Ch. 3.1 - Frequency Table. What is a frequency table? How...Ch. 3.1 - Relative Frequency. What do we mean by relative...Ch. 3.1 - Cumulative Frequency. What do we mean by...Ch. 3.1 - Binning. What is the purpose of binning? Give an...Ch. 3.1 - Does It Make Sense? For Exercises 58, determine...Ch. 3.1 - Does It Make Sense? For Exercises 58, determine...Ch. 3.1 - Does It Make Sense? For Exercises 58, determine...Ch. 3.1 - Does It Make Sense? For Exercises 58, determine...Ch. 3.1 - Pulse Rates of Females. In Exercises 912, refer to...Ch. 3.1 - Pulse Rates of Females. In Exercises 912, refer to...
Ch. 3.1 - Pulse Rates of Females. In Exercises 912, refer to...Ch. 3.1 - Pulse Rates of Females. In Exercises 912, refer to...Ch. 3.1 - Birth Days. Births at a hospital in New York State...Ch. 3.1 - Clinical Trial. As part of a clinical trial, the...Ch. 3.1 - Train Derailments. An analysis of 50 train...Ch. 3.1 - Analysis of Last Digits. Weights of respondents...Ch. 3.1 - Academy Award-Winning Male Actors. The following...Ch. 3.1 - Body Temperatures. The following data show the...Ch. 3.1 - Loaded Die. An experiment was conducted in which a...Ch. 3.1 - Interpreting Family Data. Consider the following...Ch. 3.1 - Computer Keyboards. The traditional keyboard...Ch. 3.1 - Double Binning. The students in a statistics class...Ch. 3.2 - Distribution Graph. What is a distribution of...Ch. 3.2 - Qualitative Data. Which types of graph described...Ch. 3.2 - Yearly Data. Which type of graph described in this...Ch. 3.2 - Histogram and Stemplot. Assume that a data set is...Ch. 3.2 - Prob. 5ECh. 3.2 - Does It Make Sense? For Exercises 58, determine...Ch. 3.2 - Does It Make Sense? For Exercises 58, determine...Ch. 3.2 - Does It Make Sense? For Exercises 58, determine...Ch. 3.2 - Histogram. Children living near a smelter in Texas...Ch. 3.2 - Understanding Data. Suppose you have a list of...Ch. 3.2 - Most Appropriate Display. Exercises 1114 describe...Ch. 3.2 - Most Appropriate Display. Exercises 1114 describe...Ch. 3.2 - Most Appropriate Display. Exercises 1114 describe...Ch. 3.2 - Most Appropriate Display. Exercises 1114 describe...Ch. 3.2 - Academy Award-Winning Male Actors. Exercise 17 in...Ch. 3.2 - Body Temperatures. Exercise 18 in Section 3.1...Ch. 3.2 - Job Hunting. A survey was conducted to determine...Ch. 3.2 - Job Hunting. Refer to the data given in Exercise...Ch. 3.2 - Prob. 19ECh. 3.2 - Job Application Mistakes Construct a Pareto chart...Ch. 3.2 - Dotplot. Refer to the QWERTY data in Exercise 21...Ch. 3.2 - Dotplot. Refer to the Dvorak data in Exercise 21...Ch. 3.2 - Stemplot. Construct a stemplot of these test...Ch. 3.2 - Stemplot. Listed below are the lengths (in...Ch. 3.2 - DJIA. Listed below (in order by row) are annual...Ch. 3.2 - Home Runs. Listed below (in order by row) are the...Ch. 3.3 - Multiple Data. Briefly describe how each of the...Ch. 3.3 - Prob. 2ECh. 3.3 - Prob. 3ECh. 3.3 - Prob. 4ECh. 3.3 - Does It Make Sense? For Exercises 58, determine...Ch. 3.3 - Does It Make Sense? For Exercises 58, determine...Ch. 3.3 - Does It Make Sense? For Exercises 58, determine...Ch. 3.3 - Does It Make Sense? For Exercises 58, determine...Ch. 3.3 - Public and Private Colleges. The stack plot in...Ch. 3.3 - Home Prices by Region. The graph in Figure 3.21...Ch. 3.3 - Gender and Salary. Consider the display in Figure...Ch. 3.3 - Marriage and Divorce Rates. The graph in Figure...Ch. 3.3 - Prob. 13ECh. 3.3 - College Degrees. The stack plot in Figure 3.25...Ch. 3.3 - Contour Map. For Exercises 17 and 18, refer to the...Ch. 3.3 - Prob. 18ECh. 3.3 - Prob. 19ECh. 3.3 - Prob. 20ECh. 3.3 - Infographic. For Exercises 21 and 22, refer to...Ch. 3.3 - Infographic. For Exercises 21 and 22, refer to...Ch. 3.3 - Creating Graphics. Exercises 2326 give tables of...Ch. 3.3 - Creating Graphics. Exercises 2326 give tables of...Ch. 3.3 - Firearms Fatalities. The following table...Ch. 3.3 - Prob. 26ECh. 3.4 - Perceptual Distortion. Use a ruler to measure the...Ch. 3.4 - Prob. 2ECh. 3.4 - Prob. 3ECh. 3.4 - Prob. 4ECh. 3.4 - Does It Make Sense? For Exercises 58, determine...Ch. 3.4 - Does It Make Sense? For Exercises 58, determine...Ch. 3.4 - Does It Make Sense? For Exercises 58, determine...Ch. 3.4 - Does It Make Sense? For Exercises 58, determine...Ch. 3.4 - Exaggerating a Difference. Weekly instruction time...Ch. 3.4 - Graph of Sounds. In a survey conducted by Kelton...Ch. 3.4 - Graph Dimensions. A newspaper used images of...Ch. 3.4 - Prob. 12ECh. 3.4 - Prob. 13ECh. 3.4 - DJIA. Figure 3.36 on the next page depicts the...Ch. 3.4 - Prob. 15ECh. 3.4 - Prob. 16ECh. 3.4 - Prob. 17ECh. 3.4 - Moores Law. In 1965, Intel cofounder Gordon Moore...Ch. 3.4 - Prob. 19ECh. 3.4 - Prob. 20ECh. 3.4 - Constant Dollars. The graph in Figure 3.41 shows...Ch. 3.4 - Prob. 22ECh. 3 - Listed below are measured weights (in pounds) of...Ch. 3 - Listed below are measured weights (in pounds) of...Ch. 3 - Listed below are measured weights (in pounds) of...Ch. 3 - Pie Chart for Sports Equipment. USA Today reported...Ch. 3 - Pareto Chart for Sports Equipment. Construct a...Ch. 3 - Bar Chart. Figure 3.43 shows the numbers of U.S....Ch. 3 - As a quality control manager at Ford Motor...Ch. 3 - As a quality control manager at Ford, you monitor...Ch. 3 - A stemplot is created with the braking distances...Ch. 3 - A dotplot of braking distances (in feet) of cars...Ch. 3 - The first category in a frequency table is 90100,...Ch. 3 - The first category in a relative frequency table...Ch. 3 - The third category in a frequency table has a...Ch. 3 - Prob. 8CQCh. 3 - When constructing a graph of the same categorical...Ch. 3 - Body Temperatures Listed below are body...Ch. 3 - Why are pictographs generally poor for depicting...Ch. 3 - Note that this graph plots six variables: two...Ch. 3 - Prob. 2.2FCh. 3 - Prob. 2.3F
Knowledge Booster


Learn more about
Need a deep-dive on the concept behind this application? Look no further. Learn more about this topic, statistics and related others by exploring similar questions and additional content below.Similar questions
- Techniques QUAT6221 2025 PT B... TM Tabudi Maphoru Activities Assessments Class Progress lIE Library • Help v The table below shows the prices (R) and quantities (kg) of rice, meat and potatoes items bought during 2013 and 2014: 2013 2014 P1Qo PoQo Q1Po P1Q1 Price Ро Quantity Qo Price P1 Quantity Q1 Rice 7 80 6 70 480 560 490 420 Meat 30 50 35 60 1 750 1 500 1 800 2 100 Potatoes 3 100 3 100 300 300 300 300 TOTAL 40 230 44 230 2 530 2 360 2 590 2 820 Instructions: 1 Corall dawn to tha bottom of thir ceraan urina se se tha haca nariad in archerca antarand cubmit Q Search ENG US 口X 2025/05arrow_forwardThe table below indicates the number of years of experience of a sample of employees who work on a particular production line and the corresponding number of units of a good that each employee produced last month. Years of Experience (x) Number of Goods (y) 11 63 5 57 1 48 4 54 45 3 51 Q.1.1 By completing the table below and then applying the relevant formulae, determine the line of best fit for this bivariate data set. Do NOT change the units for the variables. X y X2 xy Ex= Ey= EX2 EXY= Q.1.2 Estimate the number of units of the good that would have been produced last month by an employee with 8 years of experience. Q.1.3 Using your calculator, determine the coefficient of correlation for the data set. Interpret your answer. Q.1.4 Compute the coefficient of determination for the data set. Interpret your answer.arrow_forwardQ.3.2 A sample of consumers was asked to name their favourite fruit. The results regarding the popularity of the different fruits are given in the following table. Type of Fruit Number of Consumers Banana 25 Apple 20 Orange 5 TOTAL 50 Draw a bar chart to graphically illustrate the results given in the table.arrow_forward
- Q.2.3 The probability that a randomly selected employee of Company Z is female is 0.75. The probability that an employee of the same company works in the Production department, given that the employee is female, is 0.25. What is the probability that a randomly selected employee of the company will be female and will work in the Production department? Q.2.4 There are twelve (12) teams participating in a pub quiz. What is the probability of correctly predicting the top three teams at the end of the competition, in the correct order? Give your final answer as a fraction in its simplest form.arrow_forwardQ.2.1 A bag contains 13 red and 9 green marbles. You are asked to select two (2) marbles from the bag. The first marble selected will not be placed back into the bag. Q.2.1.1 Construct a probability tree to indicate the various possible outcomes and their probabilities (as fractions). Q.2.1.2 What is the probability that the two selected marbles will be the same colour? Q.2.2 The following contingency table gives the results of a sample survey of South African male and female respondents with regard to their preferred brand of sports watch: PREFERRED BRAND OF SPORTS WATCH Samsung Apple Garmin TOTAL No. of Females 30 100 40 170 No. of Males 75 125 80 280 TOTAL 105 225 120 450 Q.2.2.1 What is the probability of randomly selecting a respondent from the sample who prefers Garmin? Q.2.2.2 What is the probability of randomly selecting a respondent from the sample who is not female? Q.2.2.3 What is the probability of randomly…arrow_forwardTest the claim that a student's pulse rate is different when taking a quiz than attending a regular class. The mean pulse rate difference is 2.7 with 10 students. Use a significance level of 0.005. Pulse rate difference(Quiz - Lecture) 2 -1 5 -8 1 20 15 -4 9 -12arrow_forward
- The following ordered data list shows the data speeds for cell phones used by a telephone company at an airport: A. Calculate the Measures of Central Tendency from the ungrouped data list. B. Group the data in an appropriate frequency table. C. Calculate the Measures of Central Tendency using the table in point B. D. Are there differences in the measurements obtained in A and C? Why (give at least one justified reason)? I leave the answers to A and B to resolve the remaining two. 0.8 1.4 1.8 1.9 3.2 3.6 4.5 4.5 4.6 6.2 6.5 7.7 7.9 9.9 10.2 10.3 10.9 11.1 11.1 11.6 11.8 12.0 13.1 13.5 13.7 14.1 14.2 14.7 15.0 15.1 15.5 15.8 16.0 17.5 18.2 20.2 21.1 21.5 22.2 22.4 23.1 24.5 25.7 28.5 34.6 38.5 43.0 55.6 71.3 77.8 A. Measures of Central Tendency We are to calculate: Mean, Median, Mode The data (already ordered) is: 0.8, 1.4, 1.8, 1.9, 3.2, 3.6, 4.5, 4.5, 4.6, 6.2, 6.5, 7.7, 7.9, 9.9, 10.2, 10.3, 10.9, 11.1, 11.1, 11.6, 11.8, 12.0, 13.1, 13.5, 13.7, 14.1, 14.2, 14.7, 15.0, 15.1, 15.5,…arrow_forwardPEER REPLY 1: Choose a classmate's Main Post. 1. Indicate a range of values for the independent variable (x) that is reasonable based on the data provided. 2. Explain what the predicted range of dependent values should be based on the range of independent values.arrow_forwardIn a company with 80 employees, 60 earn $10.00 per hour and 20 earn $13.00 per hour. Is this average hourly wage considered representative?arrow_forward
- The following is a list of questions answered correctly on an exam. Calculate the Measures of Central Tendency from the ungrouped data list. NUMBER OF QUESTIONS ANSWERED CORRECTLY ON AN APTITUDE EXAM 112 72 69 97 107 73 92 76 86 73 126 128 118 127 124 82 104 132 134 83 92 108 96 100 92 115 76 91 102 81 95 141 81 80 106 84 119 113 98 75 68 98 115 106 95 100 85 94 106 119arrow_forwardThe following ordered data list shows the data speeds for cell phones used by a telephone company at an airport: A. Calculate the Measures of Central Tendency using the table in point B. B. Are there differences in the measurements obtained in A and C? Why (give at least one justified reason)? 0.8 1.4 1.8 1.9 3.2 3.6 4.5 4.5 4.6 6.2 6.5 7.7 7.9 9.9 10.2 10.3 10.9 11.1 11.1 11.6 11.8 12.0 13.1 13.5 13.7 14.1 14.2 14.7 15.0 15.1 15.5 15.8 16.0 17.5 18.2 20.2 21.1 21.5 22.2 22.4 23.1 24.5 25.7 28.5 34.6 38.5 43.0 55.6 71.3 77.8arrow_forwardIn a company with 80 employees, 60 earn $10.00 per hour and 20 earn $13.00 per hour. a) Determine the average hourly wage. b) In part a), is the same answer obtained if the 60 employees have an average wage of $10.00 per hour? Prove your answer.arrow_forward
arrow_back_ios
SEE MORE QUESTIONS
arrow_forward_ios
Recommended textbooks for you
 Glencoe Algebra 1, Student Edition, 9780079039897...AlgebraISBN:9780079039897Author:CarterPublisher:McGraw Hill
 Holt Mcdougal Larson Pre-algebra: Student Edition...AlgebraISBN:9780547587776Author:HOLT MCDOUGALPublisher:HOLT MCDOUGAL
 Big Ideas Math A Bridge To Success Algebra 1: Stu...AlgebraISBN:9781680331141Author:HOUGHTON MIFFLIN HARCOURTPublisher:Houghton Mifflin Harcourt
 College Algebra (MindTap Course List)AlgebraISBN:9781305652231Author:R. David Gustafson, Jeff HughesPublisher:Cengage Learning
Glencoe Algebra 1, Student Edition, 9780079039897...
Algebra
ISBN:9780079039897
Author:Carter
Publisher:McGraw Hill
Holt Mcdougal Larson Pre-algebra: Student Edition...
Algebra
ISBN:9780547587776
Author:HOLT MCDOUGAL
Publisher:HOLT MCDOUGAL
Big Ideas Math A Bridge To Success Algebra 1: Stu...
Algebra
ISBN:9781680331141
Author:HOUGHTON MIFFLIN HARCOURT
Publisher:Houghton Mifflin Harcourt
College Algebra (MindTap Course List)
Algebra
ISBN:9781305652231
Author:R. David Gustafson, Jeff Hughes
Publisher:Cengage Learning
Mod-01 Lec-01 Discrete probability distributions (Part 1); Author: nptelhrd;https://www.youtube.com/watch?v=6x1pL9Yov1k;License: Standard YouTube License, CC-BY
Discrete Probability Distributions; Author: Learn Something;https://www.youtube.com/watch?v=m9U4UelWLFs;License: Standard YouTube License, CC-BY
Probability Distribution Functions (PMF, PDF, CDF); Author: zedstatistics;https://www.youtube.com/watch?v=YXLVjCKVP7U;License: Standard YouTube License, CC-BY
Discrete Distributions: Binomial, Poisson and Hypergeometric | Statistics for Data Science; Author: Dr. Bharatendra Rai;https://www.youtube.com/watch?v=lHhyy4JMigg;License: Standard Youtube License