
Concept explainers
Videos
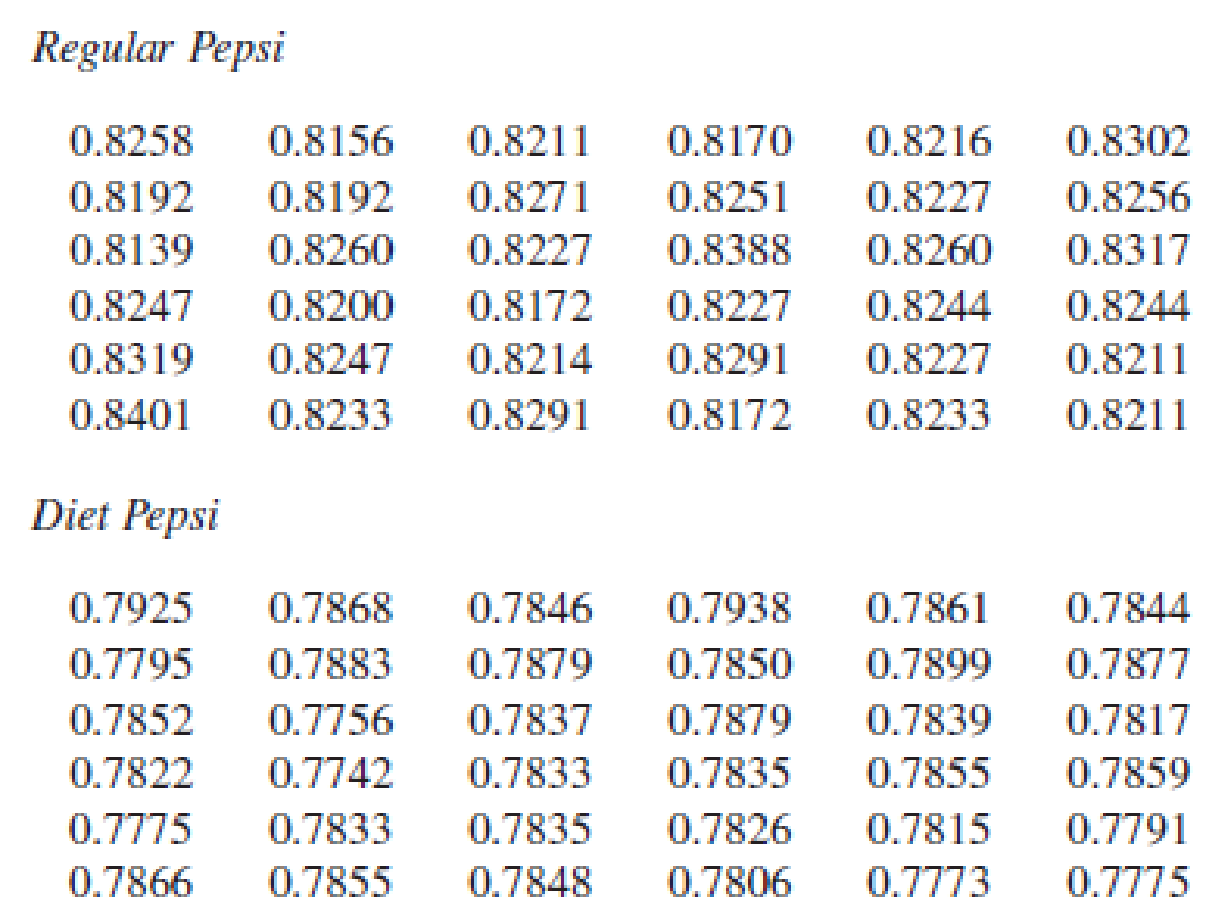
Listed below are measured weights (in pounds) of the contents in samples of cans of regular Pepsi and Diet Pepsi. Use these data for Exercises 1–3
1.
- a. Construct a frequency table for the weights of regular Pepsi. Use these bins:
0.8130–0.8179
0.8180–0.8229
0.8230–0.8279
0.8280–0.8329
0.8330–0.8379
0.8380–0.8429
- b. Construct a frequency table for the weights of Diet Pepsi. Use these bins:
0.7740–0.7779
0.7780–0.7819
0.7820–0.7859
0.7860–0.7899
0.7900–0.7939
- c. Compare the frequency tables from parts (a) and (b). What notable differences are there? How can those notable differences be explained?
a.
Create a frequency table for the weights of regular Pepsi using the given bins.
Answer to Problem 1CRE
The relative frequency table for the weights of regular Pepsi using the given bins is as follows,
| Weights | Frequency |
| 0.8130–0.8179 | 5 |
| 0.8180–0.8229 | 12 |
| 0.8230–0.8279 | 12 |
| 0.8280–0.8329 | 5 |
| 0.8330–0.8379 | 0 |
| 0.8380-0.8429 | 2 |
| Total | 36 |
Explanation of Solution
Calculation
The given information is that,the data represents the weights (in pounds) of the contents in samples of cans of Regular Pepsi and Diet Pepsi.
From the data it is observed that, the values are ranging from 0.8139 to 0.8401. One-way to arrange the data in a group with these bins are classify the weights into different groups. Those are, 0.8130-0.8179, 0.8180-0.8229, 0.8230-0.8279, 0.8280-0.8329, 0.8330-0.8379 and 0.8380-0.8429.
Now, count the frequency for each bin. That is, 5 for bin 0.8130-0.8176 because in that range there are 5 cans and for bin 0.8180-0.8229, 12. Similarly the remaining frequencies are obtained and tabulated below.
The frequency table is as follows,
| Weights | Frequency |
| 0.8130–0.8179 | 5 |
| 0.8180–0.8229 | 12 |
| 0.8230–0.8279 | 12 |
| 0.8280–0.8329 | 5 |
| 0.8330–0.8379 | 0 |
| 0.8380–0.8429 | 2 |
| Total | 36 |
b.
Create a frequency table for the weights of Diet Pepsi.
Answer to Problem 1CRE
The frequency table for the weights of Diet Pepsi is as follows,
| Weights | Frequency |
| 0.7740–0.7779 | 5 |
| 0.7780–0.7819 | 5 |
| 0.7820–0.7859 | 16 |
| 0.7860–0.7899 | 8 |
| 0.7900–0.7939 | 2 |
| Total | 36 |
Explanation of Solution
Calculation
From the data it is observed that, the values are ranging from 0.7742 to 0.7938. The groups for the weights of different bins are 0.7740-0.7779, 0.7780-0.7819, 0.7820-0.7859, 0.7860-0.7899 and 0.7900-0.7939.
Now, count the frequency for each bin. That is, 5 for bin 0.7740-0.7779 because in that range there are 5 cans and for bin 0.7780-0.7819, 5. Similarly the frequencies for remaining bins are obtained and tabulated below.
The frequency table is as follows,
| Weights | Frequency |
| 0.7740–0.7779 | 5 |
| 0.7780–0.7819 | 5 |
| 0.7820–0.7859 | 16 |
| 0.7860–0.7899 | 8 |
| 0.7900–0.7939 | 2 |
| Total | 36 |
c.
Explain whether there are any notable differences by comparing the frequency tables from parts (a) and (b).
Explanation of Solution
From the frequencies tables of parts (a) and (b) it can be observed that, the regular Pepsi weights are more than the diet Pepsi weights because of the sugar levels in the regular Pepsi. But the volumes of both type cans are approximately same.
Want to see more full solutions like this?
Chapter 3 Solutions
Statistical Reasoning for Everyday Life Plus MyLab Statistics with Pearson eText -- 18 Week Access Card Package (5th Edition)
Additional Math Textbook Solutions
Pathways To Math Literacy (looseleaf)
Mathematics for the Trades: A Guided Approach (11th Edition) (What's New in Trade Math)
Elementary Statistics: Picturing the World (7th Edition)
Basic College Mathematics


- Question 2: When John started his first job, his first end-of-year salary was $82,500. In the following years, he received salary raises as shown in the following table. Fill the Table: Fill the following table showing his end-of-year salary for each year. I have already provided the end-of-year salaries for the first three years. Calculate the end-of-year salaries for the remaining years using Excel. (If you Excel answer for the top 3 cells is not the same as the one in the following table, your formula / approach is incorrect) (2 points) Geometric Mean of Salary Raises: Calculate the geometric mean of the salary raises using the percentage figures provided in the second column named “% Raise”. (The geometric mean for this calculation should be nearly identical to the arithmetic mean. If your answer deviates significantly from the mean, it's likely incorrect. 2 points) Starting salary % Raise Raise Salary after raise 75000 10% 7500 82500 82500 4% 3300…arrow_forwardI need help with this problem and an explanation of the solution for the image described below. (Statistics: Engineering Probabilities)arrow_forwardI need help with this problem and an explanation of the solution for the image described below. (Statistics: Engineering Probabilities)arrow_forward
- 310015 K Question 9, 5.2.28-T Part 1 of 4 HW Score: 85.96%, 49 of 57 points Points: 1 Save of 6 Based on a poll, among adults who regret getting tattoos, 28% say that they were too young when they got their tattoos. Assume that six adults who regret getting tattoos are randomly selected, and find the indicated probability. Complete parts (a) through (d) below. a. Find the probability that none of the selected adults say that they were too young to get tattoos. 0.0520 (Round to four decimal places as needed.) Clear all Final check Feb 7 12:47 US Oarrow_forwardhow could the bar graph have been organized differently to make it easier to compare opinion changes within political partiesarrow_forwardDraw a picture of a normal distribution with mean 70 and standard deviation 5.arrow_forward
- What do you guess are the standard deviations of the two distributions in the previous example problem?arrow_forwardPlease answer the questionsarrow_forward30. An individual who has automobile insurance from a certain company is randomly selected. Let Y be the num- ber of moving violations for which the individual was cited during the last 3 years. The pmf of Y isy | 1 2 4 8 16p(y) | .05 .10 .35 .40 .10 a.Compute E(Y).b. Suppose an individual with Y violations incurs a surcharge of $100Y^2. Calculate the expected amount of the surcharge.arrow_forward
- 24. An insurance company offers its policyholders a num- ber of different premium payment options. For a ran- domly selected policyholder, let X = the number of months between successive payments. The cdf of X is as follows: F(x)=0.00 : x < 10.30 : 1≤x<30.40 : 3≤ x < 40.45 : 4≤ x <60.60 : 6≤ x < 121.00 : 12≤ x a. What is the pmf of X?b. Using just the cdf, compute P(3≤ X ≤6) and P(4≤ X).arrow_forward59. At a certain gas station, 40% of the customers use regular gas (A1), 35% use plus gas (A2), and 25% use premium (A3). Of those customers using regular gas, only 30% fill their tanks (event B). Of those customers using plus, 60% fill their tanks, whereas of those using premium, 50% fill their tanks.a. What is the probability that the next customer will request plus gas and fill the tank (A2 B)?b. What is the probability that the next customer fills the tank?c. If the next customer fills the tank, what is the probability that regular gas is requested? Plus? Premium?arrow_forward38. Possible values of X, the number of components in a system submitted for repair that must be replaced, are 1, 2, 3, and 4 with corresponding probabilities .15, .35, .35, and .15, respectively. a. Calculate E(X) and then E(5 - X).b. Would the repair facility be better off charging a flat fee of $75 or else the amount $[150/(5 - X)]? [Note: It is not generally true that E(c/Y) = c/E(Y).]arrow_forward
 Holt Mcdougal Larson Pre-algebra: Student Edition...AlgebraISBN:9780547587776Author:HOLT MCDOUGALPublisher:HOLT MCDOUGAL