
Statistical Reasoning for Everyday Life Plus MyLab Statistics with Pearson eText -- 18 Week Access Card Package (5th Edition)
5th Edition
ISBN: 9780135990278
Author: Bennett, Jeffrey O., Briggs, William L., Triola, Mario F.
Publisher: PEARSON
expand_more
expand_more
format_list_bulleted
Concept explainers
Videos
Textbook Question
Chapter 3.4, Problem 14E
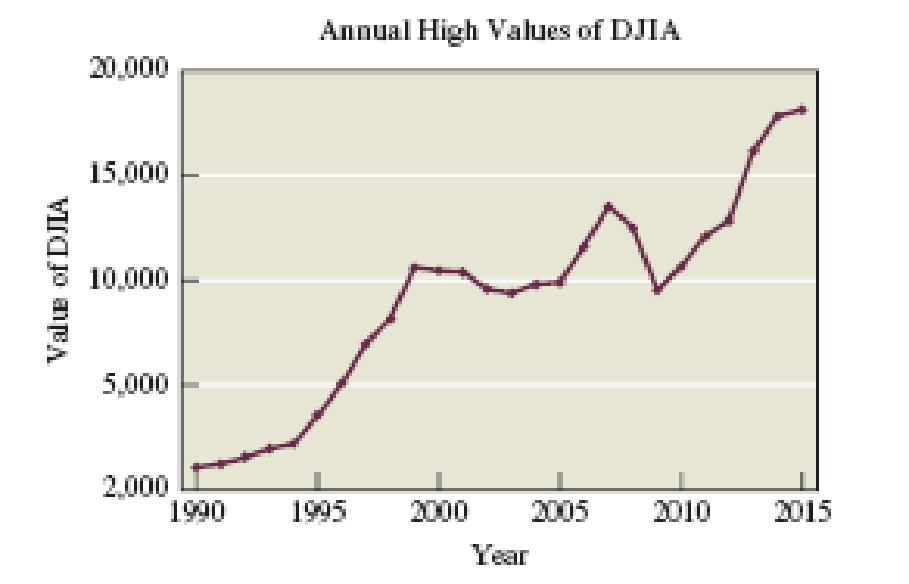
DJIA. Figure 3.36 on the next page depicts the annual high values of the Dow Jones Industrial Average (DJIA) for stocks. How is this graph misleading? How could it be drawn so that it is not misleading? In this case, would the graph change dramatically if it was not drawn to be misleading?
Expert Solution & Answer
Want to see the full answer?
Check out a sample textbook solution
Students have asked these similar questions
math
Compute the median of the following data.
32, 41, 36, 42, 29, 30, 40, 22, 25, 37
Task Description:
Read the following case study and answer the questions that follow.
Ella is a 9-year-old third-grade student in an inclusive classroom. She has been diagnosed with Emotional and Behavioural Disorder (EBD). She has been struggling academically and socially due to
challenges related to self-regulation, impulsivity, and emotional outbursts. Ella's behaviour includes frequent tantrums, defiance toward authority figures, and difficulty forming positive relationships with peers. Despite her challenges, Ella shows an interest in art and creative activities and demonstrates strong verbal skills when calm.
Describe 2 strategies that could be implemented that could help Ella regulate her emotions in class (4 marks)
Explain 2 strategies that could improve Ella’s social skills (4 marks)
Identify 2 accommodations that could be implemented to support Ella academic progress and provide a rationale for your recommendation.(6 marks)
Provide a detailed explanation of 2 ways…
Chapter 3 Solutions
Statistical Reasoning for Everyday Life Plus MyLab Statistics with Pearson eText -- 18 Week Access Card Package (5th Edition)
Ch. 3.1 - Frequency Table. What is a frequency table? How...Ch. 3.1 - Relative Frequency. What do we mean by relative...Ch. 3.1 - Cumulative Frequency. What do we mean by...Ch. 3.1 - Binning. What is the purpose of binning? Give an...Ch. 3.1 - Does It Make Sense? For Exercises 58, determine...Ch. 3.1 - Does It Make Sense? For Exercises 58, determine...Ch. 3.1 - Does It Make Sense? For Exercises 58, determine...Ch. 3.1 - Does It Make Sense? For Exercises 58, determine...Ch. 3.1 - Pulse Rates of Females. In Exercises 912, refer to...Ch. 3.1 - Pulse Rates of Females. In Exercises 912, refer to...
Ch. 3.1 - Pulse Rates of Females. In Exercises 912, refer to...Ch. 3.1 - Pulse Rates of Females. In Exercises 912, refer to...Ch. 3.1 - Birth Days. Births at a hospital in New York State...Ch. 3.1 - Clinical Trial. As part of a clinical trial, the...Ch. 3.1 - Train Derailments. An analysis of 50 train...Ch. 3.1 - Analysis of Last Digits. Weights of respondents...Ch. 3.1 - Academy Award-Winning Male Actors. The following...Ch. 3.1 - Body Temperatures. The following data show the...Ch. 3.1 - Loaded Die. An experiment was conducted in which a...Ch. 3.1 - Interpreting Family Data. Consider the following...Ch. 3.1 - Computer Keyboards. The traditional keyboard...Ch. 3.1 - Double Binning. The students in a statistics class...Ch. 3.2 - Distribution Graph. What is a distribution of...Ch. 3.2 - Qualitative Data. Which types of graph described...Ch. 3.2 - Yearly Data. Which type of graph described in this...Ch. 3.2 - Histogram and Stemplot. Assume that a data set is...Ch. 3.2 - Prob. 5ECh. 3.2 - Does It Make Sense? For Exercises 58, determine...Ch. 3.2 - Does It Make Sense? For Exercises 58, determine...Ch. 3.2 - Does It Make Sense? For Exercises 58, determine...Ch. 3.2 - Histogram. Children living near a smelter in Texas...Ch. 3.2 - Understanding Data. Suppose you have a list of...Ch. 3.2 - Most Appropriate Display. Exercises 1114 describe...Ch. 3.2 - Most Appropriate Display. Exercises 1114 describe...Ch. 3.2 - Most Appropriate Display. Exercises 1114 describe...Ch. 3.2 - Most Appropriate Display. Exercises 1114 describe...Ch. 3.2 - Academy Award-Winning Male Actors. Exercise 17 in...Ch. 3.2 - Body Temperatures. Exercise 18 in Section 3.1...Ch. 3.2 - Job Hunting. A survey was conducted to determine...Ch. 3.2 - Job Hunting. Refer to the data given in Exercise...Ch. 3.2 - Prob. 19ECh. 3.2 - Job Application Mistakes Construct a Pareto chart...Ch. 3.2 - Dotplot. Refer to the QWERTY data in Exercise 21...Ch. 3.2 - Dotplot. Refer to the Dvorak data in Exercise 21...Ch. 3.2 - Stemplot. Construct a stemplot of these test...Ch. 3.2 - Stemplot. Listed below are the lengths (in...Ch. 3.2 - DJIA. Listed below (in order by row) are annual...Ch. 3.2 - Home Runs. Listed below (in order by row) are the...Ch. 3.3 - Multiple Data. Briefly describe how each of the...Ch. 3.3 - Prob. 2ECh. 3.3 - Prob. 3ECh. 3.3 - Prob. 4ECh. 3.3 - Does It Make Sense? For Exercises 58, determine...Ch. 3.3 - Does It Make Sense? For Exercises 58, determine...Ch. 3.3 - Does It Make Sense? For Exercises 58, determine...Ch. 3.3 - Does It Make Sense? For Exercises 58, determine...Ch. 3.3 - Public and Private Colleges. The stack plot in...Ch. 3.3 - Home Prices by Region. The graph in Figure 3.21...Ch. 3.3 - Gender and Salary. Consider the display in Figure...Ch. 3.3 - Marriage and Divorce Rates. The graph in Figure...Ch. 3.3 - Prob. 13ECh. 3.3 - College Degrees. The stack plot in Figure 3.25...Ch. 3.3 - Contour Map. For Exercises 17 and 18, refer to the...Ch. 3.3 - Prob. 18ECh. 3.3 - Prob. 19ECh. 3.3 - Prob. 20ECh. 3.3 - Infographic. For Exercises 21 and 22, refer to...Ch. 3.3 - Infographic. For Exercises 21 and 22, refer to...Ch. 3.3 - Creating Graphics. Exercises 2326 give tables of...Ch. 3.3 - Creating Graphics. Exercises 2326 give tables of...Ch. 3.3 - Firearms Fatalities. The following table...Ch. 3.3 - Prob. 26ECh. 3.4 - Perceptual Distortion. Use a ruler to measure the...Ch. 3.4 - Prob. 2ECh. 3.4 - Prob. 3ECh. 3.4 - Prob. 4ECh. 3.4 - Does It Make Sense? For Exercises 58, determine...Ch. 3.4 - Does It Make Sense? For Exercises 58, determine...Ch. 3.4 - Does It Make Sense? For Exercises 58, determine...Ch. 3.4 - Does It Make Sense? For Exercises 58, determine...Ch. 3.4 - Exaggerating a Difference. Weekly instruction time...Ch. 3.4 - Graph of Sounds. In a survey conducted by Kelton...Ch. 3.4 - Graph Dimensions. A newspaper used images of...Ch. 3.4 - Prob. 12ECh. 3.4 - Prob. 13ECh. 3.4 - DJIA. Figure 3.36 on the next page depicts the...Ch. 3.4 - Prob. 15ECh. 3.4 - Prob. 16ECh. 3.4 - Prob. 17ECh. 3.4 - Moores Law. In 1965, Intel cofounder Gordon Moore...Ch. 3.4 - Prob. 19ECh. 3.4 - Prob. 20ECh. 3.4 - Constant Dollars. The graph in Figure 3.41 shows...Ch. 3.4 - Prob. 22ECh. 3 - Listed below are measured weights (in pounds) of...Ch. 3 - Listed below are measured weights (in pounds) of...Ch. 3 - Listed below are measured weights (in pounds) of...Ch. 3 - Pie Chart for Sports Equipment. USA Today reported...Ch. 3 - Pareto Chart for Sports Equipment. Construct a...Ch. 3 - Bar Chart. Figure 3.43 shows the numbers of U.S....Ch. 3 - As a quality control manager at Ford Motor...Ch. 3 - As a quality control manager at Ford, you monitor...Ch. 3 - A stemplot is created with the braking distances...Ch. 3 - A dotplot of braking distances (in feet) of cars...Ch. 3 - The first category in a frequency table is 90100,...Ch. 3 - The first category in a relative frequency table...Ch. 3 - The third category in a frequency table has a...Ch. 3 - Prob. 8CQCh. 3 - When constructing a graph of the same categorical...Ch. 3 - Body Temperatures Listed below are body...Ch. 3 - Why are pictographs generally poor for depicting...Ch. 3 - Note that this graph plots six variables: two...Ch. 3 - Prob. 2.2FCh. 3 - Prob. 2.3F
Knowledge Booster


Learn more about
Need a deep-dive on the concept behind this application? Look no further. Learn more about this topic, statistics and related others by exploring similar questions and additional content below.Similar questions
- Question 2: When John started his first job, his first end-of-year salary was $82,500. In the following years, he received salary raises as shown in the following table. Fill the Table: Fill the following table showing his end-of-year salary for each year. I have already provided the end-of-year salaries for the first three years. Calculate the end-of-year salaries for the remaining years using Excel. (If you Excel answer for the top 3 cells is not the same as the one in the following table, your formula / approach is incorrect) (2 points) Geometric Mean of Salary Raises: Calculate the geometric mean of the salary raises using the percentage figures provided in the second column named “% Raise”. (The geometric mean for this calculation should be nearly identical to the arithmetic mean. If your answer deviates significantly from the mean, it's likely incorrect. 2 points) Starting salary % Raise Raise Salary after raise 75000 10% 7500 82500 82500 4% 3300…arrow_forwardI need help with this problem and an explanation of the solution for the image described below. (Statistics: Engineering Probabilities)arrow_forwardI need help with this problem and an explanation of the solution for the image described below. (Statistics: Engineering Probabilities)arrow_forward
- 310015 K Question 9, 5.2.28-T Part 1 of 4 HW Score: 85.96%, 49 of 57 points Points: 1 Save of 6 Based on a poll, among adults who regret getting tattoos, 28% say that they were too young when they got their tattoos. Assume that six adults who regret getting tattoos are randomly selected, and find the indicated probability. Complete parts (a) through (d) below. a. Find the probability that none of the selected adults say that they were too young to get tattoos. 0.0520 (Round to four decimal places as needed.) Clear all Final check Feb 7 12:47 US Oarrow_forwardhow could the bar graph have been organized differently to make it easier to compare opinion changes within political partiesarrow_forwardDraw a picture of a normal distribution with mean 70 and standard deviation 5.arrow_forward
- What do you guess are the standard deviations of the two distributions in the previous example problem?arrow_forwardPlease answer the questionsarrow_forward30. An individual who has automobile insurance from a certain company is randomly selected. Let Y be the num- ber of moving violations for which the individual was cited during the last 3 years. The pmf of Y isy | 1 2 4 8 16p(y) | .05 .10 .35 .40 .10 a.Compute E(Y).b. Suppose an individual with Y violations incurs a surcharge of $100Y^2. Calculate the expected amount of the surcharge.arrow_forward
- 24. An insurance company offers its policyholders a num- ber of different premium payment options. For a ran- domly selected policyholder, let X = the number of months between successive payments. The cdf of X is as follows: F(x)=0.00 : x < 10.30 : 1≤x<30.40 : 3≤ x < 40.45 : 4≤ x <60.60 : 6≤ x < 121.00 : 12≤ x a. What is the pmf of X?b. Using just the cdf, compute P(3≤ X ≤6) and P(4≤ X).arrow_forward59. At a certain gas station, 40% of the customers use regular gas (A1), 35% use plus gas (A2), and 25% use premium (A3). Of those customers using regular gas, only 30% fill their tanks (event B). Of those customers using plus, 60% fill their tanks, whereas of those using premium, 50% fill their tanks.a. What is the probability that the next customer will request plus gas and fill the tank (A2 B)?b. What is the probability that the next customer fills the tank?c. If the next customer fills the tank, what is the probability that regular gas is requested? Plus? Premium?arrow_forward38. Possible values of X, the number of components in a system submitted for repair that must be replaced, are 1, 2, 3, and 4 with corresponding probabilities .15, .35, .35, and .15, respectively. a. Calculate E(X) and then E(5 - X).b. Would the repair facility be better off charging a flat fee of $75 or else the amount $[150/(5 - X)]? [Note: It is not generally true that E(c/Y) = c/E(Y).]arrow_forward
arrow_back_ios
SEE MORE QUESTIONS
arrow_forward_ios
Recommended textbooks for you
 Glencoe Algebra 1, Student Edition, 9780079039897...AlgebraISBN:9780079039897Author:CarterPublisher:McGraw Hill
 Algebra for College StudentsAlgebraISBN:9781285195780Author:Jerome E. Kaufmann, Karen L. SchwittersPublisher:Cengage Learning
 College Algebra (MindTap Course List)AlgebraISBN:9781305652231Author:R. David Gustafson, Jeff HughesPublisher:Cengage Learning
 Algebra: Structure And Method, Book 1AlgebraISBN:9780395977224Author:Richard G. Brown, Mary P. Dolciani, Robert H. Sorgenfrey, William L. ColePublisher:McDougal Littell
Glencoe Algebra 1, Student Edition, 9780079039897...
Algebra
ISBN:9780079039897
Author:Carter
Publisher:McGraw Hill
Algebra for College Students
Algebra
ISBN:9781285195780
Author:Jerome E. Kaufmann, Karen L. Schwitters
Publisher:Cengage Learning
College Algebra (MindTap Course List)
Algebra
ISBN:9781305652231
Author:R. David Gustafson, Jeff Hughes
Publisher:Cengage Learning
Algebra: Structure And Method, Book 1
Algebra
ISBN:9780395977224
Author:Richard G. Brown, Mary P. Dolciani, Robert H. Sorgenfrey, William L. Cole
Publisher:McDougal Littell
Mod-01 Lec-01 Discrete probability distributions (Part 1); Author: nptelhrd;https://www.youtube.com/watch?v=6x1pL9Yov1k;License: Standard YouTube License, CC-BY
Discrete Probability Distributions; Author: Learn Something;https://www.youtube.com/watch?v=m9U4UelWLFs;License: Standard YouTube License, CC-BY
Probability Distribution Functions (PMF, PDF, CDF); Author: zedstatistics;https://www.youtube.com/watch?v=YXLVjCKVP7U;License: Standard YouTube License, CC-BY
Discrete Distributions: Binomial, Poisson and Hypergeometric | Statistics for Data Science; Author: Dr. Bharatendra Rai;https://www.youtube.com/watch?v=lHhyy4JMigg;License: Standard Youtube License