Concept explainers
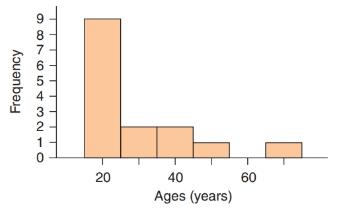
Students’ Ages Here are the ages of some students in a statistics class: 17, 19, 35, 18, 18, 20, 27, 25, 41, 21, 19, 19, 45, and 19. The teacher’s age is 66 and should be included as one of the ages when you do the calculations. The figure shows a histogram of the data.
a. Describe the distribution of ages by giving the shape, the numerical value for an appropriate measure of the center, and the numerical value for an appropriate measure of spread, as well as mentioning any outliers.
b. Make a rough sketch (or copy) of the histogram, and mark the approximate locations of the

Want to see the full answer?
Check out a sample textbook solution
Chapter 3 Solutions
INTRODUCTORY STATISTICS (LOOSELEAF)
Additional Math Textbook Solutions
Elementary Statistics ( 3rd International Edition ) Isbn:9781260092561
Basic College Mathematics
Elementary Statistics: Picturing the World (7th Edition)
Mathematics for the Trades: A Guided Approach (11th Edition) (What's New in Trade Math)
APPLIED STAT.IN BUS.+ECONOMICS
College Algebra (Collegiate Math)
- 2. Which of the following statements are (not) true? lim sup{An U Bn} 818 lim sup{A, B} 818 lim inf{An U Bn} 818 818 lim inf{A, B} An An A, Bn- A, BnB →B = = = lim sup A, U lim sup Bn; 818 818 lim sup A, lim sup Bn; 818 81U lim inf A, U lim inf Bn; 818 818 lim inf A, lim inf Bn; n→X 818 An U BRAUB as no; An OBRANB as n→∞.arrow_forwardThroughout, A, B, (An, n≥ 1), and (Bn, n≥ 1) are subsets of 2. 1. Show that AAB (ANB) U (BA) = (AUB) (AB), Α' Δ Β = Α Δ Β, {A₁ U A2} A {B₁ U B2) C (A1 A B₁}U{A2 A B2).arrow_forward16. Show that, if X and Y are independent random variables, such that E|X|< ∞, and B is an arbitrary Borel set, then EXI{Y B} = EX P(YE B).arrow_forward
- Proposition 1.1 Suppose that X1, X2,... are random variables. The following quantities are random variables: (a) max{X1, X2) and min(X1, X2); (b) sup, Xn and inf, Xn; (c) lim sup∞ X and lim inf∞ Xn- (d) If Xn(w) converges for (almost) every w as n→ ∞, then lim- random variable. → Xn is aarrow_forwardExercise 4.2 Prove that, if A and B are independent, then so are A and B, Ac and B, and A and B.arrow_forward8. Show that, if {Xn, n ≥ 1) are independent random variables, then sup X A) < ∞ for some A.arrow_forward
- 8- 6. Show that, for any random variable, X, and a > 0, 8 心 P(xarrow_forward15. This problem extends Problem 20.6. Let X, Y be random variables with finite mean. Show that 00 (P(X ≤ x ≤ Y) - P(X ≤ x ≤ X))dx = E Y — E X.arrow_forward(b) Define a simple random variable. Provide an example.arrow_forward17. (a) Define the distribution of a random variable X. (b) Define the distribution function of a random variable X. (c) State the properties of a distribution function. (d) Explain the difference between the distribution and the distribution function of X.arrow_forward16. (a) Show that IA(w) is a random variable if and only if A E Farrow_forward15. Let 2 {1, 2,..., 6} and Fo({1, 2, 3, 4), (3, 4, 5, 6}). (a) Is the function X (w) = 21(3, 4) (w)+711.2,5,6) (w) a random variable? Explain. (b) Provide a function from 2 to R that is not a random variable with respect to (N, F). (c) Write the distribution of X. (d) Write and plot the distribution function of X.arrow_forwardarrow_back_iosSEE MORE QUESTIONSarrow_forward_ios
 Glencoe Algebra 1, Student Edition, 9780079039897...AlgebraISBN:9780079039897Author:CarterPublisher:McGraw Hill
 Holt Mcdougal Larson Pre-algebra: Student Edition...AlgebraISBN:9780547587776Author:HOLT MCDOUGALPublisher:HOLT MCDOUGAL
 Big Ideas Math A Bridge To Success Algebra 1: Stu...AlgebraISBN:9781680331141Author:HOUGHTON MIFFLIN HARCOURTPublisher:Houghton Mifflin Harcourt


