Regional Population Density The figure shows the population density (people per square mile) for the 50 states in the United States, based on an estimate from the U.S. Census Bureau. The regions are the Midwest (MW), Northeast (NE), South (S), and West (W). In the West, the potential outlier is California, and in the South, the potential outlier is Maryland. Why is it best to compare medians and interquartile ranges for these data rather than comparing means and standard deviations? List the approximate median number of people per square mile for each location; for example, the median for the MW is between 50 and 100. Also arrange the regions from lowest interquartile range (on the left) to highest.
Regional Population Density The figure shows the population density (people per square mile) for the 50 states in the United States, based on an estimate from the U.S. Census Bureau. The regions are the Midwest (MW), Northeast (NE), South (S), and West (W). In the West, the potential outlier is California, and in the South, the potential outlier is Maryland. Why is it best to compare medians and interquartile ranges for these data rather than comparing means and standard deviations? List the approximate median number of people per square mile for each location; for example, the median for the MW is between 50 and 100. Also arrange the regions from lowest interquartile range (on the left) to highest.
Solution Summary: The author explains why it is best to compare medians and interquartile ranges for the data rather than comparing means and standard deviations.
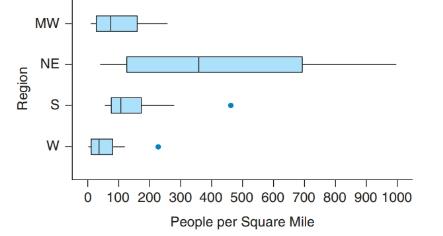
Regional Population Density The figure shows the population density (people per square mile) for the 50 states in the United States, based on an estimate from the U.S. Census Bureau. The regions are the Midwest (MW), Northeast (NE), South (S), and West (W). In the West, the potential outlier is California, and in the South, the potential outlier is Maryland.
Why is it best to compare medians and interquartile ranges for these data rather than comparing means and standard deviations? List the approximate median number of people per square mile for each location; for example, the median for the MW is between 50 and 100. Also arrange the regions from lowest interquartile range (on the left) to highest.
Problem 1.We consider a two-period binomial model with the following properties: each period lastsone (1) year and the current stock price is S0 = 4. On each period, the stock price doubleswhen it moves up and is reduced by half when it moves down. The annual interest rateon the money market is 25%.
We consider four options on this market: A European call option with maturity T = 2 years and strike price K = 5; A European put option with maturity T = 2 years and strike price K = 5; An American call option with maturity T = 2 years and strike price K = 5; An American put option with maturity T = 2 years and strike price K = 5.(a) Find the price at time 0 of both European options.(b) Find the price at time 0 of both American options. Compare your results with (a)and comment.(c) For each of the American options, describe the optimal exercising strategy.(d) We assume that you sell the American put to a market participant A for the pricefound in (b). Explain how you act on the market…
What is the standard scores associated to the left of z is 0.1446
Note: The purpose of this problem below is to use computational techniques (Excelspreadsheet, Matlab, R, Python, etc.) and code the dynamic programming ideas seen inclass. Please provide the numerical answer to the questions as well as a sample of yourwork (spreadsheet, code file, etc.).We consider an N-period binomial model with the following properties: N = 60, thecurrent stock price is S0 = 1000; on each period, the stock price increases by 0.5% whenit moves up and decreases by 0.3% when it moves down. The annual interest rate on themoney market is 5%. (Notice that this model is a CRR model, which means that thebinomial tree is recombining.)(a) Find the price at time t0 = 0 of a (European) call option with strike price K = 1040and maturity T = 1 year.(b) Find the price at time t0 = 0 of a (European) put option with strike price K = 1040and maturity T = 1 year.(c) We consider now, that you are at time t5 (i.e. after 5 periods, which represents 1month later). Assume that the stock…
Need a deep-dive on the concept behind this application? Look no further. Learn more about this topic, statistics and related others by exploring similar questions and additional content below.


 Big Ideas Math A Bridge To Success Algebra 1: Stu...AlgebraISBN:9781680331141Author:HOUGHTON MIFFLIN HARCOURTPublisher:Houghton Mifflin Harcourt
 Glencoe Algebra 1, Student Edition, 9780079039897...AlgebraISBN:9780079039897Author:CarterPublisher:McGraw Hill
 Holt Mcdougal Larson Pre-algebra: Student Edition...AlgebraISBN:9780547587776Author:HOLT MCDOUGALPublisher:HOLT MCDOUGAL