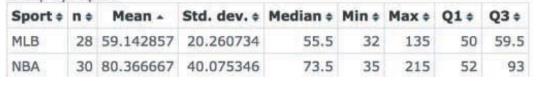
Professional Sports Ticket Prices The following histograms show ticket prices for professional baseball (MLB) and professional basketball (NBA) tickets. a. Based on the shape of the distributions, which measure of center should be used to compare the prices: the mean or the median ? b. Write a short report comparing the ticket prices for professional baseball and basketball. In your report comment on the typical ticket prices and the variability in ticket prices. Summary statistics for Ticket Price: Group by: Sport
Professional Sports Ticket Prices The following histograms show ticket prices for professional baseball (MLB) and professional basketball (NBA) tickets. a. Based on the shape of the distributions, which measure of center should be used to compare the prices: the mean or the median ? b. Write a short report comparing the ticket prices for professional baseball and basketball. In your report comment on the typical ticket prices and the variability in ticket prices. Summary statistics for Ticket Price: Group by: Sport
Solution Summary: The author explains that median is the best measure of center to compare the ticket prices for professional baseball and basketball.
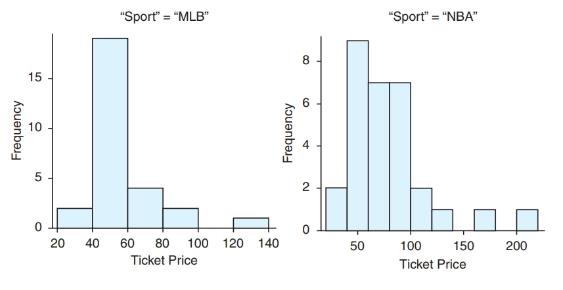
Professional Sports Ticket Prices The following histograms show ticket prices for professional baseball (MLB) and professional basketball (NBA) tickets.
a. Based on the shape of the distributions, which measure of center should be used to compare the prices: the mean or the median?
b. Write a short report comparing the ticket prices for professional baseball and basketball. In your report comment on the typical ticket prices and the variability in ticket prices.
08:34
◄ Classroom
07:59
Probs. 5-32/33
D
ا.
89
5-34. Determine the horizontal and vertical components
of reaction at the pin A and the normal force at the smooth
peg B on the member.
A
0,4 m
0.4 m
Prob. 5-34
F=600 N
fr
th
ar
0.
163586
5-37. The wooden plank resting between the buildings
deflects slightly when it supports the 50-kg boy. This
deflection causes a triangular distribution of load at its ends.
having maximum intensities of w, and wg. Determine w
and wg. each measured in N/m. when the boy is standing
3 m from one end as shown. Neglect the mass of the plank.
0.45 m
3 m
Examine the Variables: Carefully review and note the names of all variables in the dataset. Examples of these variables include:
Mileage (mpg)
Number of Cylinders (cyl)
Displacement (disp)
Horsepower (hp)
Research: Google to understand these variables.
Statistical Analysis: Select mpg variable, and perform the following statistical tests. Once you are done with these tests using mpg variable, repeat the same with hp
Mean
Median
First Quartile (Q1)
Second Quartile (Q2)
Third Quartile (Q3)
Fourth Quartile (Q4)
10th Percentile
70th Percentile
Skewness
Kurtosis
Document Your Results:
In RStudio: Before running each statistical test, provide a heading in the format shown at the bottom. “# Mean of mileage – Your name’s command”
In Microsoft Word: Once you've completed all tests, take a screenshot of your results in RStudio and paste it into a Microsoft Word document. Make sure that snapshots are very clear. You will need multiple snapshots. Also transfer these results to the…
Elementary Statistics ( 3rd International Edition ) Isbn:9781260092561
Knowledge Booster
Learn more about
Need a deep-dive on the concept behind this application? Look no further. Learn more about this topic, statistics and related others by exploring similar questions and additional content below.


 Big Ideas Math A Bridge To Success Algebra 1: Stu...AlgebraISBN:9781680331141Author:HOUGHTON MIFFLIN HARCOURTPublisher:Houghton Mifflin Harcourt
 Glencoe Algebra 1, Student Edition, 9780079039897...AlgebraISBN:9780079039897Author:CarterPublisher:McGraw Hill
 Holt Mcdougal Larson Pre-algebra: Student Edition...AlgebraISBN:9780547587776Author:HOLT MCDOUGALPublisher:HOLT MCDOUGAL