Videos
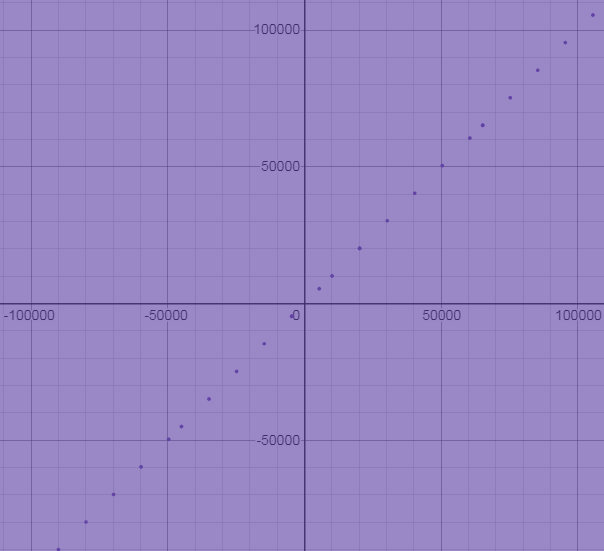
To graph: The inequality
Explanation of Solution
Given information:
The inequality given here is
Graph:
The graph of the above inequality is obtained as below.
The solution of the inequality is the set of all ordered pair of numbers such that it satisfies the inequality. In case of single variable inequality, it is those values of that variable which satisfy this inequality. In case of two variable inequality , the graph is some portion of the number line and in case of two variable inequality, it is the graph on a plane .
These are the steps to be followed in order to graph any inequality.
- Replace the inequality symbol with an equal sign and plot the obtained equation.
- Take any point in one of the half plane of that line to see if it satisfies the inequality.
- If the chosen point satisfies the inequality, then this half plane is the solution. Else, the other half plane is the solution of that inequality.
Interpretation:
First , the equation
The graph of the above inequality is obtained as below.
The solution of the inequality is the set of all ordered pair of numbers such that it satisfies the inequality. In case of single variable inequality, it is those values of that variable which satisfy this inequality.In case of two variable inequality , the graph is some portion of the number line.and in case of two variable inequality, it is the graph on a plane .
These are the steps to be followed in order to graph any inequality.
Chapter 2 Solutions
Algebra 2
Additional Math Textbook Solutions
Intro Stats, Books a la Carte Edition (5th Edition)
Elementary Statistics: Picturing the World (7th Edition)
College Algebra with Modeling & Visualization (5th Edition)
Calculus: Early Transcendentals (2nd Edition)
Thinking Mathematically (6th Edition)
Algebra and Trigonometry (6th Edition)


- 1. vector projection. Assume, ER1001 and you know the following: ||||=4, 7=-0.5.7. For each of the following, explicitly compute the value. འབ (a) (b) (c) (d) answer. Explicitly compute ||y7||. Explain your answer. Explicitly compute the cosine similarity of and y. Explain your Explicitly compute (x, y). Explain your answer. Find the projection of onto y and the projection of onto .arrow_forward2. Answer the following questions using vectors u and v. --0-0-0 = find the the cosine similarity and the angle between u and v. འརྒྱ (a) (b) find the scalar projection of u onto v. (c) find the projection of u onto v. (d) (e) (f) find the scalar projection of onto u. find the projection of u onto u. find the projection of u onto and the projection of onto . (Hint: find the inner product and verify the orthogonality)arrow_forwardPlease type out answerarrow_forward
- The function f(x) = log x is transformed to produce g(x) = log (x) – 3. Identify the type of transformation and describe the change. Please type out answerarrow_forwardEach graph below is the graph of a system of three linear equations in three unknowns of the form Ax = b. Determine whether each system has a solution and, if it does, the number of free variables. A. O free variables ✓ B. no solution C. no solution D. no solution E. 1 free variable F. 1 free variablearrow_forwardSolve the following systems of equations and show all work.y = x2 + 3y = x + 5 Please type out answerarrow_forward
- Solve the following system of equations. Show all work and solutions.y = 2x2 + 6x + 1y = −4x2 + 1 Please type out answerarrow_forwardDalia buys 20 collectible gems per month. Grace sells 10 gems from her collection of 120 each month. When will Dalia have more gems than Grace? Show your work. Dear Student If You Face any issue let me know i will solve your all doubt. I will provide solution again in more detail systematic and organized way. I would also like my last 3 questions credited to mearrow_forwardDalia buys 20 collectible gems per month. Grace sells 10 gems from her collection of 120 each month. When will Dalia have more gems than Grace? Show your work.arrow_forward
 Algebra and Trigonometry (6th Edition)AlgebraISBN:9780134463216Author:Robert F. BlitzerPublisher:PEARSON
 Contemporary Abstract AlgebraAlgebraISBN:9781305657960Author:Joseph GallianPublisher:Cengage Learning
 Linear Algebra: A Modern IntroductionAlgebraISBN:9781285463247Author:David PoolePublisher:Cengage Learning
 Algebra And Trigonometry (11th Edition)AlgebraISBN:9780135163078Author:Michael SullivanPublisher:PEARSON
 Introduction to Linear Algebra, Fifth EditionAlgebraISBN:9780980232776Author:Gilbert StrangPublisher:Wellesley-Cambridge Press
 College Algebra (Collegiate Math)AlgebraISBN:9780077836344Author:Julie Miller, Donna GerkenPublisher:McGraw-Hill Education