Concept explainers
Videos
a.
Find a regression equation for the data.
a.
Answer to Problem 49STP
Explanation of Solution
Given information:
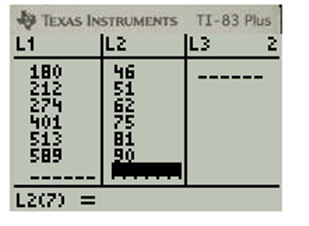
The table shows the relationship between the total number of male students per school and the number of students who tried out for the football team.
Find a regression equation for the data.
Calculation:
Consider the table showing the relationship between the total number of male students per school and the number of students who tried out for the football team
Use the regression capabilities of the graphing utility to find the linear regression line for the data.
The least square regression line is expressed as
Here
Press
Press ENTER until the calculator screen says “Done”.
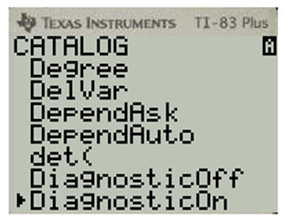

Press y
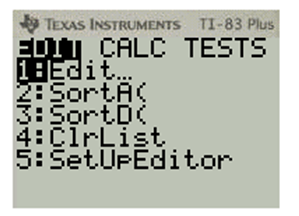
Put the values of 1
Press
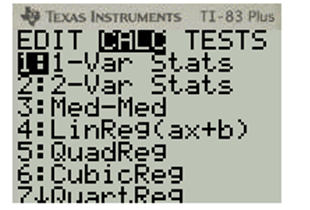
Select the LnReg
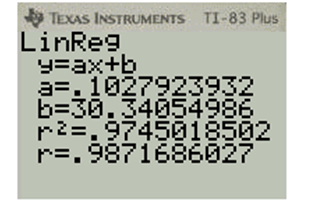
Hence, the required linear regression line is:
b.
Determine the
b.
Answer to Problem 49STP
Explanation of Solution
Given information:
The table shows the relationship between the total number of male students per school and the number of students who tried out for the football team.
Determine the
Calculation:
Hence, the correlation coefficient is
c.
How many students will try out for football at a school with
c.
Answer to Problem 49STP
Explanation of Solution
Given information:
The table shows the relationship between the total number of male students per school and the number of students who tried out for the football team.
Predict how many students will try out for football at a school with
Calculation:
Consider the school with
Substitute
Hence, the number of students tried out for the football team is
Chapter 2 Solutions
Algebra 2
Additional Math Textbook Solutions
University Calculus: Early Transcendentals (4th Edition)
Intro Stats, Books a la Carte Edition (5th Edition)
A Problem Solving Approach To Mathematics For Elementary School Teachers (13th Edition)
Thinking Mathematically (6th Edition)
Pre-Algebra Student Edition


- Instructions: Answer each question showing all work. 1. Out of 30 animals at a veterinarian clinic, 8 cats and 4 dogs have been vaccinated. 6 cats and 12 dogs are not yet vaccinated. Create a two-way frequency table to represent the data. 2. Convert the table from number 1 into a two-way relative frequency table. Instructions: Based on the tables created in questions 1 and 2 above, answer questions 3-7. 3. What percentage of cats from the total animals are vaccinated? 4. What is the relative frequency of dogs from the total animals that are not yet vaccinated? 5. What is the conditional frequency of cats that have not been vaccinated? 6. What is the marginal frequency of the total number of animals vaccinated? 7. What is the joint frequency of the cats that are vaccinated?arrow_forwardThe the high 3000arrow_forwardHow long will it take you to double your money if you invest it at a rate of 8% compounded annually?arrow_forward
- One hundred dollars is invested at 7.2% interest compounded annually. Determine how much the investment is worth after: a. I year b. 5 years c. 10 years d. 20 years e. Use your answers to parts (a)-(d) to estimate the doubling time for the investment.arrow_forward6) A farmer has 60 acres on which to plant oats or corn. Each acre of oats requires 100 lbs of fertilizer and 1 hour of labor. Each acre of corn requires 50 lbs of fertilizer and 2 hours of labor. The farmer has 5000 lbs of fertilizer and 100 hours available for labor. If the profit is $60 from each acre of oats and $100 from each acre of corn, what planting combination will produce the greatest total profit? a) Fill in the following chart to help organize the information given in the problem: Oats Labor Fertilizer Land Profit b) Write down the question of interest. Corn Available c) Define variables to answer the question of interest. Call these x and y. d) Write the objective function to answer the question of interest. e) List any constraints given in the problem.arrow_forwardI need help with number 5.arrow_forward
- 3) Use the following system of linear inequalities graphed below to answer the questions. a) Use the graph to write the symbolic form of the system of linear inequalities. b) Is (-4,2) a solution to the system? Explain. 5 -7 -5 -3 -2 0 2 3 4 $ 6 -2 -6 -7arrow_forward) Graph the feasible region subject to the following constraints. x + y ≤ 6 y ≤ 2x x ≥ 0, y ≥ 0 P + xarrow_forwardSolve the following system of equations: 50x+20y=1800 10x+3y=300arrow_forward
- > > > we are hiring Salesforce Admin Location: Remote Key Responsibilities: Administer Salesforce Sales & Revenue Cloud (CPQ & Billing) Configure workflows, validation rules & dashboards Automate processes using Flows & Process Builder Collaborate with Sales, Finance & Marketing teams Manage user roles & security Apply: Hr@forcecraver.comarrow_forwardAnswer this questionarrow_forward1. vector projection. Assume, ER1001 and you know the following: ||||=4, 7=-0.5.7. For each of the following, explicitly compute the value. འབ (a) (b) (c) (d) answer. Explicitly compute ||y7||. Explain your answer. Explicitly compute the cosine similarity of and y. Explain your Explicitly compute (x, y). Explain your answer. Find the projection of onto y and the projection of onto .arrow_forward
 Algebra and Trigonometry (6th Edition)AlgebraISBN:9780134463216Author:Robert F. BlitzerPublisher:PEARSON
 Contemporary Abstract AlgebraAlgebraISBN:9781305657960Author:Joseph GallianPublisher:Cengage Learning
 Linear Algebra: A Modern IntroductionAlgebraISBN:9781285463247Author:David PoolePublisher:Cengage Learning
 Algebra And Trigonometry (11th Edition)AlgebraISBN:9780135163078Author:Michael SullivanPublisher:PEARSON
 Introduction to Linear Algebra, Fifth EditionAlgebraISBN:9780980232776Author:Gilbert StrangPublisher:Wellesley-Cambridge Press
 College Algebra (Collegiate Math)AlgebraISBN:9780077836344Author:Julie Miller, Donna GerkenPublisher:McGraw-Hill Education