Concept explainers
Videos
a.
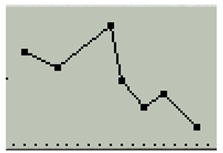
Sketch a graph of the regression line.
a.
Answer to Problem 10PPS
Explanation of Solution
Given information:
The table at the right shows the relationship between the number of students in a mathematics class and the average grade for each class.
Make a
Calculation:
Consider the table provided in the textbook which shows the relationship between the number of students in a mathematics class and the average grade of each class.
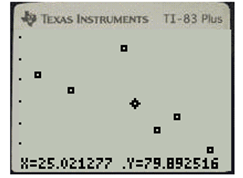
Make a scatter plot for the data using
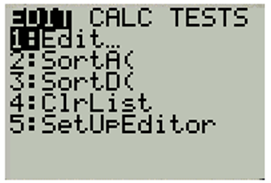
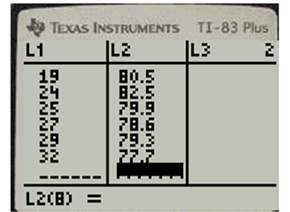
First press STAT key. Then select option 1 for the list editor and press ENTER.
Enter the value of
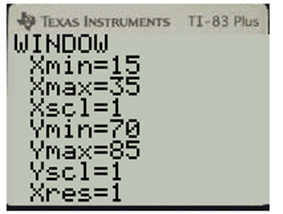
Press WINDOW key and set the viewing window to fit the data.
Press 2nd key and then MODE, to quit list editor. Now, press 2nd key followed by 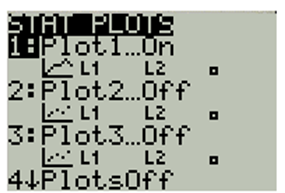
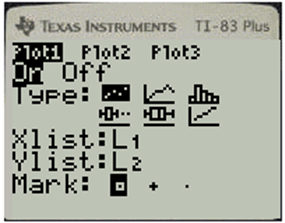
Press ENTER to get the stat plot in ON mode. Then scroll down, select scatter and press ENTER. Then press ENTER corresponding to
Press ZOOM key followed by the key
Enter the values for
Enter
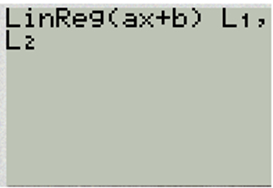
Press ENTER to get the value of
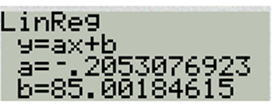
Hence the equation for line of regression is
Enter the values for
Press 2nd key and then MODE, to quit list editor. Now, press 2nd key followed by
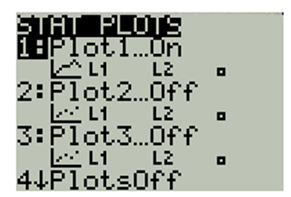
Press ENTER to get the stat plot in ON mode. Then scroll down, select line of regression and
Press ENTER. Then press ENTER corresponding to
Press zoom key followed by the key 9, to display the graph of a linear regression.
b.
What is the
b.
Answer to Problem 10PPS
Explanation of Solution
Given information:
The table at the right shows the relationship between the number of students in a mathematics class and the average grade for each class.
What is the
Calculation:
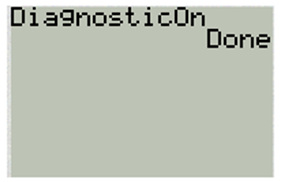
To calculate the correlation coefficient, press 2nd key and the 0 key to enter your calculator’s catalog. Scroll until you see “diagnostics ON”.
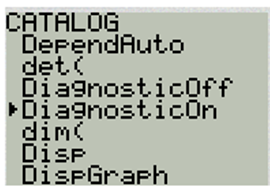
Press ENTER until the calculator screen says “Done”
Enter the values for
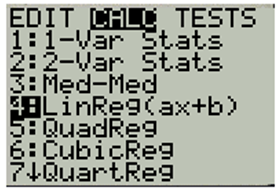
Then press 2nd key and then MODE, to quit list editor. Now press STAT key and choose CALC and select option 4 to obtain the correlation coefficient.
Enter
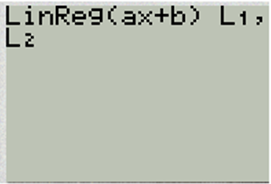
Press ENTER to get the correlation coefficient.
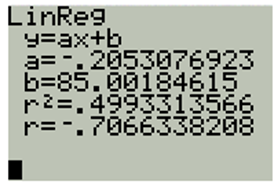
Hence, the correlation coefficient of the data is
c.
How accurate is the regression equation.
c.
Answer to Problem 10PPS
The average grade for the class decreases by about
Explanation of Solution
Given information:
The table at the right shows the relationship between the number of students in a mathematics class and the average grade for each class.
Describe the correlation? How accurate is the regression equation.
Calculation:
Consider the equation for line of regression.
It can be interpolated from the slope of regression line that the average grade for the class decreases by about
Hence, the average grade for the class decreases by about
Chapter 2 Solutions
Algebra 2
Additional Math Textbook Solutions
Using and Understanding Mathematics: A Quantitative Reasoning Approach (6th Edition)
Elementary Statistics (13th Edition)
Pre-Algebra Student Edition
Calculus: Early Transcendentals (2nd Edition)
A First Course in Probability (10th Edition)


- 1. Given that h(t) = -5t + 3 t². A tangent line H to the function h(t) passes through the point (-7, B). a. Determine the value of ẞ. b. Derive an expression to represent the gradient of the tangent line H that is passing through the point (-7. B). c. Hence, derive the straight-line equation of the tangent line H 2. The function p(q) has factors of (q − 3) (2q + 5) (q) for the interval -3≤ q≤ 4. a. Derive an expression for the function p(q). b. Determine the stationary point(s) of the function p(q) c. Classify the stationary point(s) from part b. above. d. Identify the local maximum of the function p(q). e. Identify the global minimum for the function p(q). 3. Given that m(q) = -3e-24-169 +9 (-39-7)(-In (30-755 a. State all the possible rules that should be used to differentiate the function m(q). Next to the rule that has been stated, write the expression(s) of the function m(q) for which that rule will be applied. b. Determine the derivative of m(q)arrow_forwardSafari File Edit View History Bookmarks Window Help Ο Ω OV O mA 0 mW ర Fri Apr 4 1 222 tv A F9 F10 DII 4 F6 F7 F8 7 29 8 00 W E R T Y U S D பட 9 O G H J K E F11 + 11 F12 O P } [arrow_forwardSo confused. Step by step instructions pleasearrow_forward
- In simplest terms, Sketch the graph of the parabola. Then, determine its equation. opens downward, vertex is (- 4, 7), passes through point (0, - 39)arrow_forwardIn simplest way, For each quadratic relation, find the zeros and the maximum or minimum. a) y = x 2 + 16 x + 39 b) y = 5 x2 - 50 x - 120arrow_forwardIn simplest terms and step by step Write each quadratic relation in standard form, then fi nd the zeros. y = - 4( x + 6)2 + 36arrow_forward
- In simplest terms and step by step For each quadratic relation, find the zeros and the maximum or minimum. 1) y = - 2 x2 - 28 x + 64 2) y = 6 x2 + 36 x - 42arrow_forwardWrite each relation in standard form a)y = 5(x + 10)2 + 7 b)y = 9(x - 8)2 - 4arrow_forwardIn simplest form and step by step Write the quadratic relation in standard form, then fi nd the zeros. y = 3(x - 1)2 - 147arrow_forward
- Step by step instructions The path of a soccer ball can be modelled by the relation h = - 0.1 d 2 + 0.5 d + 0.6, where h is the ball’s height and d is the horizontal distance from the kicker. a) Find the zeros of the relation.arrow_forwardIn simplest terms and step by step how do you find the zeros of y = 6x2 + 24x - 192arrow_forwardStep by step Find the zeros of each quadratic relation. a) y = x2 - 16xarrow_forward
 Algebra and Trigonometry (6th Edition)AlgebraISBN:9780134463216Author:Robert F. BlitzerPublisher:PEARSON
 Contemporary Abstract AlgebraAlgebraISBN:9781305657960Author:Joseph GallianPublisher:Cengage Learning
 Linear Algebra: A Modern IntroductionAlgebraISBN:9781285463247Author:David PoolePublisher:Cengage Learning
 Algebra And Trigonometry (11th Edition)AlgebraISBN:9780135163078Author:Michael SullivanPublisher:PEARSON
 Introduction to Linear Algebra, Fifth EditionAlgebraISBN:9780980232776Author:Gilbert StrangPublisher:Wellesley-Cambridge Press
 College Algebra (Collegiate Math)AlgebraISBN:9780077836344Author:Julie Miller, Donna GerkenPublisher:McGraw-Hill Education