
Concept explainers
Videos
a.
Make a
a.
Answer to Problem 9PPS

Explanation of Solution
Given information:
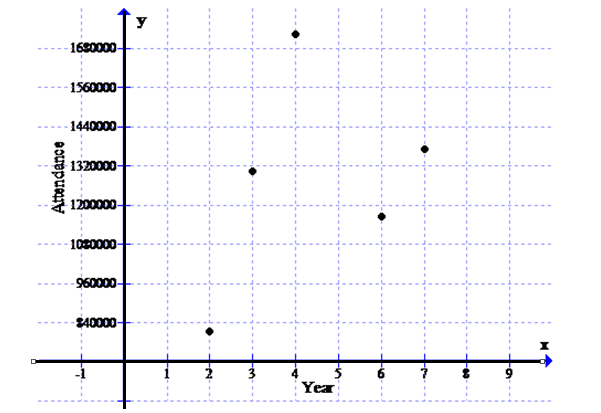
The table at the right shows the total attendance for the Florida Marlins in some recent years.
Make a scatter plot of the data.
Calculation: The objective is to make a scatter plot of the data.
The scatter plot is drawn below.
b.
Find a regression equation for the data.
b.
Answer to Problem 9PPS
Explanation of Solution
Given information:
The table at the right shows the total attendance for the Florida Marlins in some recent years.
Find a regression equation for the data.
Calculation:
The objective is to use a graphing calculator to find an equation.
In the graphing calculator, press
And in the
Then select
Hence, the equation is
c.
Predict the attendance in
c.
Answer to Problem 9PPS
Explanation of Solution
Given information:
The table at the right shows the total attendance for the Florida Marlins in some recent years.
Predict the attendance in
Calculation:
The objective is to predict the value in
In the graphing calculator, copy the regression equation in
Then use VALUE on the CALC menu to find the value of
Hence, the value is
d.
How reasonable is your prediction?
d.
Answer to Problem 9PPS
The prediction is unreasonable.
Explanation of Solution
Given information:
The table at the right shows the total attendance for the Florida Marlins in some recent years.
How reasonable is your prediction? Explain.
Calculation:
The prediction is unreasonable. The attendance will not increase without bound because attendance is largely dependent on the team’s winning status.
Hence, the prediction is unreasonable.
Chapter 2 Solutions
Algebra 2
Additional Math Textbook Solutions
University Calculus: Early Transcendentals (4th Edition)
A First Course in Probability (10th Edition)
College Algebra with Modeling & Visualization (5th Edition)
Elementary Statistics: Picturing the World (7th Edition)


- Solve the following systems of equations and show all work.y = x2 + 3y = x + 5 Please type out answerarrow_forwardSolve the following system of equations. Show all work and solutions.y = 2x2 + 6x + 1y = −4x2 + 1 Please type out answerarrow_forwardDalia buys 20 collectible gems per month. Grace sells 10 gems from her collection of 120 each month. When will Dalia have more gems than Grace? Show your work. Dear Student If You Face any issue let me know i will solve your all doubt. I will provide solution again in more detail systematic and organized way. I would also like my last 3 questions credited to mearrow_forward
- Dalia buys 20 collectible gems per month. Grace sells 10 gems from her collection of 120 each month. When will Dalia have more gems than Grace? Show your work.arrow_forwardSolve the following system of equations. Show all work and solutions.y = 2x2 + 6x + 1y = −4x2 + 1arrow_forwardSolve the following systems of equations and show all work.y = x2 + 3y = x + 5arrow_forward
- Write an equation for the function shown. You may assume all intercepts and asymptotes are on integers. The blue dashed lines are the asymptotes. 10 9- 8- 7 6 5 4- 3- 2 4 5 15-14-13-12-11-10 -9 -8 -7 -6 -5 -4 -3 -2 1 1 2 3 -1 -2 -3 -4 1 -5 -6- -7 -8- -9 -10+ 60 7 8 9 10 11 12 13 14 15arrow_forwardUse the graph of the polynomial function of degree 5 to identify zeros and multiplicity. Order your zeros from least to greatest. -6 3 6+ 5 4 3 2 1 2 -1 -2 -3 -4 -5 3 4 6 Zero at with multiplicity Zero at with multiplicity Zero at with multiplicityarrow_forwardUse the graph to identify zeros and multiplicity. Order your zeros from least to greatest. 6 5 4 -6-5-4-3-2 3 21 2 1 2 4 5 ૪ 345 Zero at with multiplicity Zero at with multiplicity Zero at with multiplicity Zero at with multiplicity པ་arrow_forward
- Use the graph to write the formula for a polynomial function of least degree. -5 + 4 3 ♡ 2 12 1 f(x) -1 -1 f(x) 2 3. + -3 12 -5+ + xarrow_forwardUse the graph to identify zeros and multiplicity. Order your zeros from least to greatest. 6 -6-5-4-3-2-1 -1 -2 3 -4 4 5 6 a Zero at with multiplicity Zero at with multiplicity Zero at with multiplicity Zero at with multiplicityarrow_forwardUse the graph to write the formula for a polynomial function of least degree. 5 4 3 -5 -x 1 f(x) -5 -4 -1 1 2 3 4 -1 -2 -3 -4 -5 f(x) =arrow_forward
 Algebra and Trigonometry (6th Edition)AlgebraISBN:9780134463216Author:Robert F. BlitzerPublisher:PEARSON
 Contemporary Abstract AlgebraAlgebraISBN:9781305657960Author:Joseph GallianPublisher:Cengage Learning
 Linear Algebra: A Modern IntroductionAlgebraISBN:9781285463247Author:David PoolePublisher:Cengage Learning
 Algebra And Trigonometry (11th Edition)AlgebraISBN:9780135163078Author:Michael SullivanPublisher:PEARSON
 Introduction to Linear Algebra, Fifth EditionAlgebraISBN:9780980232776Author:Gilbert StrangPublisher:Wellesley-Cambridge Press
 College Algebra (Collegiate Math)AlgebraISBN:9780077836344Author:Julie Miller, Donna GerkenPublisher:McGraw-Hill Education