Concept explainers
Videos
a.
Make a
a.
Answer to Problem 3PPS
 And the correlation is negative.
Explanation of Solution
Given information:
The table shows the number of CDs sold in recent years at Jerome’s House of Music.
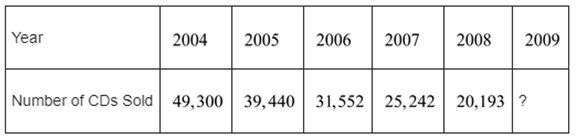
Make a scatter plot and a line of fit, and describe the correlation.
Calculation:
The objective is to make a scatter plot and fit a line. And describe the correlation.
The scatter plot is drawn below.
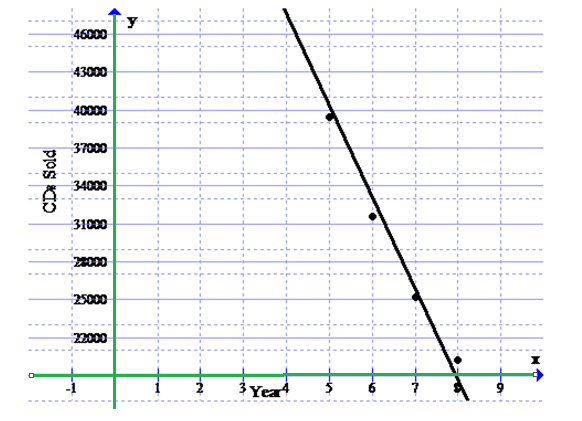
Hence, From the graph it is seen that the line is strongly
b.
Use two ordered pairs to write a prediction equation.
b.
Answer to Problem 3PPS
Explanation of Solution
Given information:
The table shows the number of CDs sold in recent years at Jerome’s House of Music.

Use two ordered pairs to write a prediction equation.
Calculation:
The objective is to consider two points write a prediction equation.
Let, the two points be
At first find the slope of the line.
So, the formula to find the slope of the line is given below.
After that consider the first point and the slope to find the equation of the line in slope intercept form.
Hence, the equation is
c.
Use your prediction equation to predict the missing value
c.
Answer to Problem 3PPS
Explanation of Solution
Given information:
The table shows the number of CDs sold in recent years at Jerome’s House of Music.

Use your prediction equation to predict the missing value.
Calculation:
The objection is to find the missing value.
The missing value is calculated below.
Hence, the missing value is
Chapter 2 Solutions
Algebra 2
Additional Math Textbook Solutions
Pre-Algebra Student Edition
Intro Stats, Books a la Carte Edition (5th Edition)
Elementary Statistics (13th Edition)
A Problem Solving Approach To Mathematics For Elementary School Teachers (13th Edition)
Algebra and Trigonometry (6th Edition)


- Write the equation for the graphed function. -8 ง -6-5 + 5 4 3 2 1 -3 -2 -1 -1 -2 4 5 6 6 -8- f(x) 7 8arrow_forwardWrite the equation for the graphed function. 8+ 7 -8 ง A -6-5 + 6 5 4 3 -2 -1 2 1 -1 3 2 3 + -2 -3 -4 -5 16 -7 -8+ f(x) = ST 0 7 8arrow_forwardThe following is the graph of the function f. 48- 44 40 36 32 28 24 20 16 12 8 4 -4 -3 -1 -4 -8 -12 -16 -20 -24 -28 -32 -36 -40 -44 -48+ Estimate the intervals where f is increasing or decreasing. Increasing: Decreasing: Estimate the point at which the graph of ƒ has a local maximum or a local minimum. Local maximum: Local minimum:arrow_forward
- For the following exercise, find the domain and range of the function below using interval notation. 10+ 9 8 7 6 5 4 3 2 1 10 -9 -8 -7 -6 -5 -4 -3 -2 -1 2 34 5 6 7 8 9 10 -1 -2 Domain: Range: -4 -5 -6 -7- 67% 9 -8 -9 -10-arrow_forward1. Given that h(t) = -5t + 3 t². A tangent line H to the function h(t) passes through the point (-7, B). a. Determine the value of ẞ. b. Derive an expression to represent the gradient of the tangent line H that is passing through the point (-7. B). c. Hence, derive the straight-line equation of the tangent line H 2. The function p(q) has factors of (q − 3) (2q + 5) (q) for the interval -3≤ q≤ 4. a. Derive an expression for the function p(q). b. Determine the stationary point(s) of the function p(q) c. Classify the stationary point(s) from part b. above. d. Identify the local maximum of the function p(q). e. Identify the global minimum for the function p(q). 3. Given that m(q) = -3e-24-169 +9 (-39-7)(-In (30-755 a. State all the possible rules that should be used to differentiate the function m(q). Next to the rule that has been stated, write the expression(s) of the function m(q) for which that rule will be applied. b. Determine the derivative of m(q)arrow_forwardSafari File Edit View History Bookmarks Window Help Ο Ω OV O mA 0 mW ర Fri Apr 4 1 222 tv A F9 F10 DII 4 F6 F7 F8 7 29 8 00 W E R T Y U S D பட 9 O G H J K E F11 + 11 F12 O P } [arrow_forward
- So confused. Step by step instructions pleasearrow_forwardIn simplest terms, Sketch the graph of the parabola. Then, determine its equation. opens downward, vertex is (- 4, 7), passes through point (0, - 39)arrow_forwardIn simplest way, For each quadratic relation, find the zeros and the maximum or minimum. a) y = x 2 + 16 x + 39 b) y = 5 x2 - 50 x - 120arrow_forward
- In simplest terms and step by step Write each quadratic relation in standard form, then fi nd the zeros. y = - 4( x + 6)2 + 36arrow_forwardIn simplest terms and step by step For each quadratic relation, find the zeros and the maximum or minimum. 1) y = - 2 x2 - 28 x + 64 2) y = 6 x2 + 36 x - 42arrow_forwardWrite each relation in standard form a)y = 5(x + 10)2 + 7 b)y = 9(x - 8)2 - 4arrow_forward
 Algebra and Trigonometry (6th Edition)AlgebraISBN:9780134463216Author:Robert F. BlitzerPublisher:PEARSON
 Contemporary Abstract AlgebraAlgebraISBN:9781305657960Author:Joseph GallianPublisher:Cengage Learning
 Linear Algebra: A Modern IntroductionAlgebraISBN:9781285463247Author:David PoolePublisher:Cengage Learning
 Algebra And Trigonometry (11th Edition)AlgebraISBN:9780135163078Author:Michael SullivanPublisher:PEARSON
 Introduction to Linear Algebra, Fifth EditionAlgebraISBN:9780980232776Author:Gilbert StrangPublisher:Wellesley-Cambridge Press
 College Algebra (Collegiate Math)AlgebraISBN:9780077836344Author:Julie Miller, Donna GerkenPublisher:McGraw-Hill Education