Concept explainers
Videos
(a)
Interpretation:
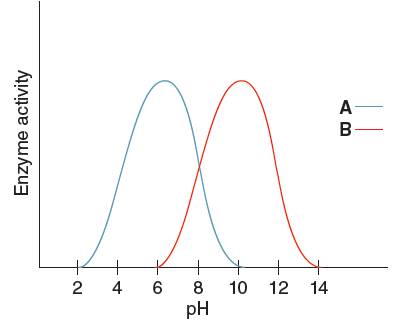
The optimum pH for enzyme 'A' needs to be determined, using the given pH versus enzyme activity graph for enzyme A and B.

Concept Introduction:
Enzymes are defined as a biological catalyst for various reactions in the living organisms. Enzymes are like all catalyst as it also increases the rate reaction but they themselves do not changed permanently during the process. Enzyme does not alter the position of equilibrium and the relative energy of both the reactant and the products. Reaction when catalyzed by an enzyme increases the
Answer to Problem 21.83P
Optimum pH for enzyme 'A' is
Explanation of Solution
The activity of enzyme is affected by both the temperature and pH. By increasing temperature, rate of reaction also increases until its maximum activity occurs that is at
Optimum pH is the pH at which the activity of an enzyme is maximum. So, from the given graph, the activity of enzyme A is maximum at pH 6. Hence the optimum pH of enzyme A is 6.
(b)
Interpretation:
The optimum pH for enzyme 'B' needs to be determined, using the given pH versus enzyme activity graph for enzyme A and B.

Concept Introduction:
Enzymes are defined as a biological catalyst for various reactions in the living organisms. Enzymes are like all catalyst as it also increases the rate reaction but they themselves do not changed permanently during the process. Enzyme does not alter the position of equilibrium and the relative energy of both the reactant and the products. Reaction when catalyzed by an enzyme increases the rate of reaction by
Answer to Problem 21.83P
Optimum pH for enzyme 'B' is
Explanation of Solution
The activity of enzyme is affected by both the temperature and pH. By increasing temperature, rate of reaction also increases until its maximum activity occurs that is at
Optimum pH is the pH at which the activity of an enzyme is maximum. So, from the given graph, the activity of enzyme B is maximum at pH 10.
Hence, the optimum pH of enzyme B is 10.
(c)
Interpretation:
The enzyme having the higher activity when pH is

Concept Introduction:
Enzymes are defined as a biological catalyst for various reactions in the living organisms. Enzymes are like all catalyst as it also increases the rate reaction but they themselves do not changed permanently during the process. Enzyme does not alter the position of equilibrium and the relative energy of both the reactant and the products. Reaction when catalyzed by an enzyme increases the rate of reaction by
Answer to Problem 21.83P
Enzyme 'A' will have higher pH at
Explanation of Solution
The activity of enzyme is affected by both the temperature and pH. Optimum pH is the pH value at which the enzyme is most active. The rate of enzyme catalyzed reaction is maximum at optimum pH
The graph shown below clearly explains the activity of an enzyme with change in pH values:
From the given graph, it can be seen that the activity of enzyme B starts from pH 6 onwards and activity of enzyme A starts from pH 2 onwards. So, before pH 2 enzyme A is inactive and before pH 6 enzyme B is inactive. Therefore, at pH 4 the activity of enzyme A is higher than that of enzyme B.
(d)
Interpretation:
The enzyme having the higher activity at pH
Concept Introduction:
Enzymes are defined as a biological catalyst for various reactions in the living organisms. Enzymes are like all catalyst as it also increases the rate reaction but they themselves do not changed permanently during the process. Enzyme does not alter the position of equilibrium and the relative energy of both the reactant and the products. Reaction when catalyzed by an enzyme increases the rate of reaction by
Answer to Problem 21.83P
Enzyme 'B' will have the higher activity at pH
Explanation of Solution
The activity of enzyme is affected by both the temperature and pH. Optimum pH is the pH value at which the enzyme is most active. The rate of enzyme catalyzed reaction is maximum at optimum pH
The graph shown below clearly explains the activity of an enzyme with change in pH values:
From the given graph, it can be seen that the activity of enzyme B starts from pH 6 onwards and becomes maximum at pH 10and then activity of enzyme starts decreasing. And activity of enzyme A starts from pH 2 onwards and becomes maximum at pH 6 and then starts decreasing.
At pH 9, activity of enzyme A is decreasing and that of enzyme B is increasing. Hence, at pH 9 activity of enzyme B is higher than that of enzyme A.
Want to see more full solutions like this?
Chapter 21 Solutions
General, Organic, & Biological Chemistry


- What is the final product when D-galactose reacts with hydroxylamine?arrow_forwardIndicate the formula of the product obtained by reacting methyl 5-chloro-5-oxopentanoate with 1 mole of 4-penten-1-ylmagnesium bromide.arrow_forwardIn the two chair conformations of glucose, the most stable is the one with all the OH groups in the equatorial position. Is this correct?arrow_forward
- please help me with my homeworkarrow_forwardhelparrow_forwardThe temperature on a sample of pure X held at 1.25 atm and -54. °C is increased until the sample boils. The temperature is then held constant and the pressure is decreased by 0.42 atm. On the phase diagram below draw a path that shows this set of changes. pressure (atm) 2 0 0 200 400 temperature (K) Xarrow_forward
- QUESTION: Answer Question 5: 'Calculating standard error of regression' STEP 1 by filling in all the empty green boxes *The values are all provided in the photo attached*arrow_forwardpressure (atm) 3 The pressure on a sample of pure X held at 47. °C and 0.88 atm is increased until the sample condenses. The pressure is then held constant and the temperature is decreased by 82. °C. On the phase diagram below draw a path that shows this set of changes. 0 0 200 temperature (K) 400 аarrow_forwarder your payment details | bar xb Home | bartleby x + aleksogi/x/isl.exe/1o u-lgNskr7j8P3jH-1Qs_pBanHhviTCeeBZbufuBYT0Hz7m7D3ZcW81NC1d8Kzb4srFik1OUFhKMUXzhGpw7k1 O States of Matter Sketching a described thermodynamic change on a phase diagram 0/5 The pressure on a sample of pure X held at 47. °C and 0.88 atm is increased until the sample condenses. The pressure is then held constant and the temperature is decreased by 82. °C. On the phase diagram below draw a path that shows this set of changes. pressure (atm) 1 3- 0- 0 200 Explanation Check temperature (K) 400 X Q Search L G 2025 McGraw Hill LLC. All Rights Reserved Terms of Use Privacy Cearrow_forward
 Introductory Chemistry: A FoundationChemistryISBN:9781337399425Author:Steven S. Zumdahl, Donald J. DeCostePublisher:Cengage Learning
 World of Chemistry, 3rd editionChemistryISBN:9781133109655Author:Steven S. Zumdahl, Susan L. Zumdahl, Donald J. DeCostePublisher:Brooks / Cole / Cengage Learning
 World of ChemistryChemistryISBN:9780618562763Author:Steven S. ZumdahlPublisher:Houghton Mifflin College Div
 General, Organic, and Biological ChemistryChemistryISBN:9781285853918Author:H. Stephen StokerPublisher:Cengage Learning
 Organic And Biological ChemistryChemistryISBN:9781305081079Author:STOKER, H. Stephen (howard Stephen)Publisher:Cengage Learning,
 Chemistry for Today: General, Organic, and Bioche...ChemistryISBN:9781305960060Author:Spencer L. Seager, Michael R. Slabaugh, Maren S. HansenPublisher:Cengage Learning