Concept explainers
Videos
Evaluating Projects at Nexcom Systems
Nexcom Systems develops information technology systems for commercial sale. Each year it considers and evaluates a number of different projects to undertake. It develops a road map for each project in the form of a decision tree that identifies the different decision points in the development process from the initial decision to invest in a project’s development through the actual commercialization of the final product.
The first decision point in the development process is whether or not to fund a proposed project for one year. If the decision is no, then there is no resulting cost; if the decision is yes, then the project proceeds at an incremental cost to the company. The company establishes specific short-term, early technical milestones for its projects after one year. If the early milestones are achieved, the project proceeds to the next phase of project development; if the milestones are not achieved, the project is abandoned. In its planning process, the company develops probability estimates of achieving and not achieving the early milestones. If the early milestones are achieved, then the project is funded for further development during an extended time frame specific to a project. At the end of this time frame, a project is evaluated according to a second set of (later) technical milestones. Again the company attaches probability estimates for achieving and not achieving these later milestones. If the late milestones are not achieved, the project is abandoned.
If the late milestones are achieved, this means that technical uncertainties and problems have been overcome and the company next assesses the project’s ability to meet its strategic business objectives. At this stage the company wants to know if the eventual product coincides with the company’s competencies, and if there appears to be an eventual clear market for the product. It invests in a product “prelaunch” to ascertain the answers to these questions. The outcomes of the prelaunch are that either there is a strategic fit or there is not, and the company assigns probability estimates to each of these two possible outcomes. If there is not a strategic fit at this point, the project is abandoned and the company loses its investment in the prelaunch process. If it is determined that there is a strategic fit, then three possible decisions result. (1) The company can invest in the product’s launch and a successful or unsuccessful outcome will result, each with an estimated probability of occurrence. (2) The company can delay the product’s launch and at a later date decide whether to launch or abandon. (3) If it launches later, then the outcomes are success or failure, each with an estimated probability of occurrence. Also, if the product launch is delayed, there is always a likelihood that the technology will become obsolete or dated in the near future, which tends to reduce the expected return.
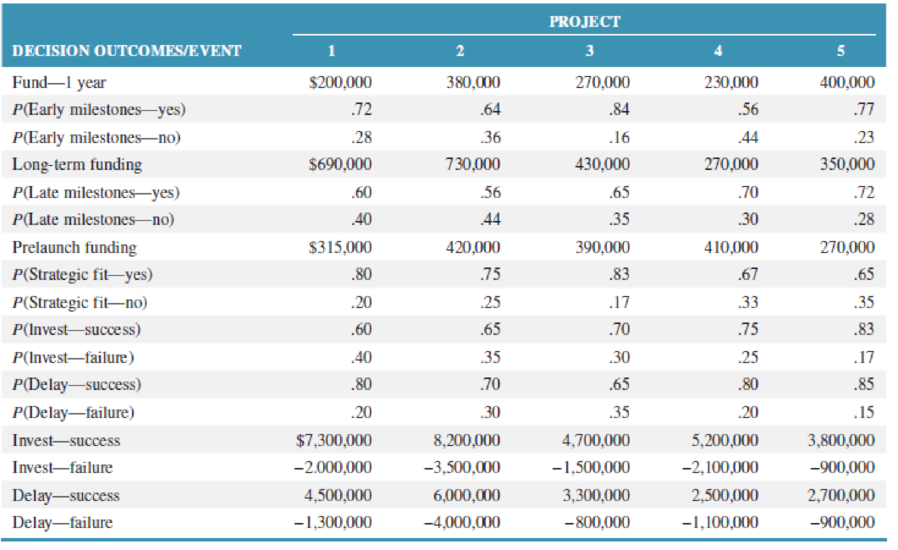
The table provides the various costs, event probabilities, and investment outcomes for five projects the company is considering.
Determine the expected value for each project and then rank the projects accordingly for the company to consider.
Want to see the full answer?
Check out a sample textbook solution
Chapter 1 Solutions
Operations and Supply Chain Management 9th edition
Additional Business Textbook Solutions
Corporate Finance (4th Edition) (Pearson Series in Finance) - Standalone book
Marketing: An Introduction (13th Edition)
Operations Management
Principles Of Taxation For Business And Investment Planning 2020 Edition
Financial Accounting: Tools for Business Decision Making, 8th Edition
Horngren's Cost Accounting: A Managerial Emphasis (16th Edition)


- PepsiCo South Africa says the incident where a woman discovered part of a rodent in her loaf of bread, is anisolated occurrence.Durban woman, Nombulelo Mkumla, took to social media last week to share how she discovered the rodent.In a lengthy Facebook post, she said she purchased the loaf of bread from a local shop after work on August 27.For the next days, Mkumla proceeded to use slices of bread from the load to make toast."Then, on the morning of August 31, I took the bread out of the fridge to make toast and noticed something disgusting andscary. I took a picture and sent it to my friends, and one of them said, 'Yi mpuku leyo tshomi' [That's a rat friend]“."I was in denial and suggested it might be something else, but the rat scenario made sense - it's possible the rat got into thebread at the factory, and no one noticed," Mkumla said.She went back to the shop she'd bought the bread from and was told to lay a complaint directly with the supplier.She sent an email with a video and…arrow_forwardThe deaths are included in the discharges; this includes deaths occurring in less than 48 hours and postoperative deaths. Rehabilitation had 362 discharges, 22 deaths, 1<48 hours, 0 Postoperative. what is the gross death rate for the rehabilitation service?arrow_forwardA copy machine is available 24 hours a day. On a typical day, the machine produces 100 jobs. Each job takes about 3 minutes on the machine, 2 minutes of which is processing time and 1 minute is setup time (logging in, defining the job). About 20 percent of the jobs need to be reworked, in which case the setup time and the processing time have to be repeated. The remainder of the time, the equipment is idle. What is the OEE of the equipment?arrow_forward
- How do you think we can keep updating Toyota's ideas as new technologies come out and what customers want keeps changing?arrow_forwardGiven how TPS has helped change things in so many fields, do you think there are parts of it that might be hard to use in areas that aren’t about making things, like in healthcare or services? If so, why do you think that might be?arrow_forwardDo you feel there is anything positive about rework?arrow_forward
- Do you think technology can achieve faster setup times? How would it be implemented in the hospital workforce?arrow_forwardIn your experience or opinion, do you think process changes like organizing workspaces make a bigger difference, or is investing in technology usually the better solution for faster setups?arrow_forwardHave you seen rework done in your business, and what was done to prevent that from occurring again?arrow_forward
- Research a company different than case studies examined and search the internet and find an example of a business that had to rework a process. How was the organization affected to rework a process in order to restore a good flow unit? Did rework hurt a process or improve the organization's operational efficiency? • Note: Include a reference with supportive citations in the discussion reply in your post.arrow_forwardSetup time is very important in affecting a process and the capacity of a process. How do you reduce setup time? Give examples of reducing setup time. Please Provide a referenecearrow_forwardDo you think TPS was successful? If so, how? Are there other companies that have used TPS? If so, give examples. Please provide a referencearrow_forward
 Practical Management ScienceOperations ManagementISBN:9781337406659Author:WINSTON, Wayne L.Publisher:Cengage,
 Purchasing and Supply Chain ManagementOperations ManagementISBN:9781285869681Author:Robert M. Monczka, Robert B. Handfield, Larry C. Giunipero, James L. PattersonPublisher:Cengage Learning
 Management, Loose-Leaf VersionManagementISBN:9781305969308Author:Richard L. DaftPublisher:South-Western College Pub