Concept explainers
To identify: the function as linear or non-linear, estimate and interpret the intercepts of graph.
Explanation of Solution
Given:

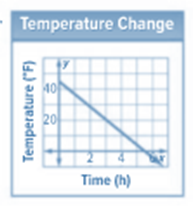
Here, x - axis represents time in hours.
y - axis represents Temperature in
When the graph is interpreted it is clearly observable that the graph is a straight line and as the time increases the temperature keeps on falling at a constant rate and all the values of time has a unique temperature value which means this graph shows a function. Hence this graph is a linear function.
This graph is decreasing graph because the value of temperature is falling as the time passes by.
Here, x - intercept is (5.5, 0)
When the graph is observed at the x - intercept it can be said that, at 5.5 hours, the temperature will fall to
Also, y - intercept is (0, 40.5)
When the graph is observed at the y - intercept it can be said that, at 0 hours, the temperature will be
Chapter 1 Solutions
Glencoe Algebra 1, Student Edition, 9780079039897, 0079039898, 2018
Additional Math Textbook Solutions
Calculus: Early Transcendentals (2nd Edition)
Elementary Statistics (13th Edition)
Pre-Algebra Student Edition
Algebra and Trigonometry (6th Edition)
College Algebra with Modeling & Visualization (5th Edition)
- Use the graph of y = f(x) to answer the following. 3- 2 -4 -2 -1 1 2 3 4 -1 2 m -3- + (d) Find all x for which f(x) = -2. If there is more than one value, separate them with commas or write your answer in interval notation, if necessary. Select "None", if applicable. Value(s) of x for which f(x)=-2: | (0,0) (0,0) (0,0) (0,0) 0,0... -00 None (h) Determine the range of f. The range is (0,0) Garrow_forwardWhat is g(f(4))arrow_forward10) Multiply (8m + 3)² A) 8m²+11m+6 B) m² + 48m+9 C) 64m²+48m+9 D) 16m²+11m+6arrow_forward
- Let R be field and X= R³/s Vector space over R M=(a,b,c)labic, e Rra+b= 3- <3 Show that Ms and why with proof. 1) is convexset and affine set of botost ii) is blanced set and symmetirs set of x iii) is hy per space and hyper plane ofx or hot iii) find f:MR st kerf = M 18/103 and finnd fiM→R/{0} st M= {xEX, f(t) = x, texiαER? jiii) show that Mis Maxsubspace or not and Mis a max. affine set or not.arrow_forwardFind The partial fraction decomposition for each The following 2× B) (x+3) a 3 6 X-3x+2x-6arrow_forward1) Find the partial feraction decomposition for each of 5- X 2 2x+x-1 The following: 3 B) 3 X + 3xarrow_forward
- Kate, Luke, Mary and Nancy are sharing a cake. The cake had previously been divided into four slices (s1, s2, s3 and s4). The following table shows the values of the slices in the eyes of each player. What is fair share to nancy? S1 S2 S3 S4 Kate $4.00 $6.00 $6.00 $4.00 Luke $5.30 $5.00 $5.25 $5.45 Mary $4.25 $4.50 $3.50 $3.75 Nancy $6.00 $4.00 $4.00 $6.00arrow_forwardKate, Luke, Mary and Nancy are sharing a cake. The cake had previously been divided into four slices (s1, s2, s3 and s4). The following table shows the values of the slices in the eyes of each player. S1 S2 S3 S4 Kate $4.00 $6.00 $6.00 $4.00 Luke $5.30 $5.00 $5.25 $5.45 Mary $4.25 $4.50 $3.50 $3.75 Nancy $6.00 $4.00 $4.00 $6.00 how much is the cak worth to maryarrow_forwardKate, Luke, Mary and Nancy are sharing a cake. The cake had previously been divided into four slices (s1, s2, s3 and s4). The following table shows the values of the slices in the eyes of each player. What is the threshold of fair share for Luke? S1 S2 S3 S4 Kate $4.00 $6.00 $6.00 $4.00 Luke $5.30 $5.00 $5.25 $5.45 Mary $4.25 $4.50 $3.50 $3.75 Nancy $6.00 $4.00 $4.00 $6.00arrow_forward
 Algebra and Trigonometry (6th Edition)AlgebraISBN:9780134463216Author:Robert F. BlitzerPublisher:PEARSON
 Contemporary Abstract AlgebraAlgebraISBN:9781305657960Author:Joseph GallianPublisher:Cengage Learning
 Linear Algebra: A Modern IntroductionAlgebraISBN:9781285463247Author:David PoolePublisher:Cengage Learning
 Algebra And Trigonometry (11th Edition)AlgebraISBN:9780135163078Author:Michael SullivanPublisher:PEARSON
 Introduction to Linear Algebra, Fifth EditionAlgebraISBN:9780980232776Author:Gilbert StrangPublisher:Wellesley-Cambridge Press
 College Algebra (Collegiate Math)AlgebraISBN:9780077836344Author:Julie Miller, Donna GerkenPublisher:McGraw-Hill Education


