
Concept explainers
Videos
(a)
To describe: The accuracy of the line.
(a)
Explanation of Solution
Given:
The graph of the mass of marbles is shown in Figure 1.
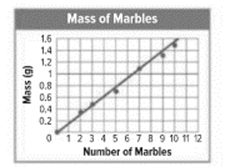
Figure 1
Each point on the graph shows the relation between the number of marble and its mass where the number of marbles is the independent variable and the mass is dependent variable.
The accuracy of the line depends on the closeness of the points to the line.
It can be seen from the given graph that some points are above the line and some are below the line and some are passing through.
The points are close to the line. Therefore, there is high
The points are close to the line but all points do not pass through the line. In conclusion accuracy is quite good but not perfectly correct.
(b)
To find: The approximate mass of 7 marbles.
(b)
Answer to Problem 10PPS
The approximate mass of 7 marbles is 1.1g.
Explanation of Solution
Given:
The graph of the mass of marbles is shown in Figure 1.

Figure 1
The number of marbles is shown on the horizontal axis that is independent variable and the mass is shown on the vertical axis that is dependent variable.
See the point for 7 marbles on the graph.
It can be observed from Figure 1 that the approximate mass of 7 marbles is 1.1g.
Therefore, the approximate mass of 7 marbles is 1.1g.
(c)
To explain: The reason of few points is above the line and some are below the line.
(c)
Explanation of Solution
Given:
The graph of the mass of marbles is shown in Figure 1.

Figure 1
The set of points are the
The line of best fit is the line passes through the points or closely to the point. If half of the data points on the scatter point is below the line and half above the line.
It can be seen from Figure 1 that the data points come close to the line of the best fit that means the
The positive correlation is high since it predicts the values near the line some points are above the line and some are below the line.
Chapter 1 Solutions
Glencoe Algebra 1, Student Edition, 9780079039897, 0079039898, 2018
Additional Math Textbook Solutions
Elementary Statistics (13th Edition)
Algebra and Trigonometry (6th Edition)
Thinking Mathematically (6th Edition)
A Problem Solving Approach To Mathematics For Elementary School Teachers (13th Edition)
A First Course in Probability (10th Edition)


- Solve questions by Course Name (Ordinary Differential Equations II 2)arrow_forwardplease Solve questions by Course Name( Ordinary Differential Equations II 2)arrow_forwardInThe Northern Lights are bright flashes of colored light between 50 and 200 miles above Earth. Suppose a flash occurs 150 miles above Earth. What is the measure of arc BD, the portion of Earth from which the flash is visible? (Earth’s radius is approximately 4000 miles.)arrow_forward
- e). n! (n - 1)!arrow_forwardSuppose you flip a fair two-sided coin four times and record the result. a). List the sample space of this experiment. That is, list all possible outcomes that could occur when flipping a fair two-sided coin four total times. Assume the two sides of the coin are Heads (H) and Tails (T).arrow_forwarde). n! (n - 1)!arrow_forward
- Evaluate the following expression and show your work to support your calculations. a). 6! b). 4! 3!0! 7! c). 5!2! d). 5!2! e). n! (n - 1)!arrow_forwardAmy and Samiha have a hat that contains two playing cards, one ace and one king. They are playing a game where they randomly pick a card out of the hat four times, with replacement. Amy thinks that the probability of getting exactly two aces in four picks is equal to the probability of not getting exactly two aces in four picks. Samiha disagrees. She thinks that the probability of not getting exactly two aces is greater. The sample space of possible outcomes is listed below. A represents an ace, and K represents a king. Who is correct?arrow_forwardConsider the exponential function f(x) = 12x. Complete the sentences about the key features of the graph. The domain is all real numbers. The range is y> 0. The equation of the asymptote is y = 0 The y-intercept is 1arrow_forward
- The graph shows Alex's distance from home after biking for x hours. What is the average rate of change from -1 to 1 for the function? 4-2 о A. -2 О B. 2 О C. 1 O D. -1 ty 6 4 2 2 0 X 2 4arrow_forwardWrite 7. √49 using rational exponents. ○ A. 57 47 B. 7 O C. 47 ○ D. 74arrow_forwardCan you check If my short explantions make sense because I want to make sure that I describe this part accuratelyarrow_forward
 Algebra and Trigonometry (6th Edition)AlgebraISBN:9780134463216Author:Robert F. BlitzerPublisher:PEARSON
 Contemporary Abstract AlgebraAlgebraISBN:9781305657960Author:Joseph GallianPublisher:Cengage Learning
 Linear Algebra: A Modern IntroductionAlgebraISBN:9781285463247Author:David PoolePublisher:Cengage Learning
 Algebra And Trigonometry (11th Edition)AlgebraISBN:9780135163078Author:Michael SullivanPublisher:PEARSON
 Introduction to Linear Algebra, Fifth EditionAlgebraISBN:9780980232776Author:Gilbert StrangPublisher:Wellesley-Cambridge Press
 College Algebra (Collegiate Math)AlgebraISBN:9780077836344Author:Julie Miller, Donna GerkenPublisher:McGraw-Hill Education