
Concept explainers
Videos
To compare: The practice run by two students John and Dante during cross country practice.
Answer to Problem 75SGR
John did a 50 minute run and Dante did a 55 minute run during cross country practice.
Explanation of Solution
Given information:
The graphical representation of practice run of John is provided below

Practice run of Dante is described as, he leaves for high school and runs at a steady rate for 18 minutes until he reaches middle school which is about 3.2 miles away. He runs around 10 laps around the track in middle school in 14 minutes. Then he runs back to high school to complete 55 minute run.
Formula used:
The graph of a function is said to be linear is it is straight line. If it is a curve it is non-linear.
When the graph of the function lies above the x -axis the function is said to be positive otherwise negative.
When the graph of the function goes up it is an increasing function when viewed from left to right otherwise function is decreasing.
Calculation:
Consider the graphical representation of practice run of John is provided below
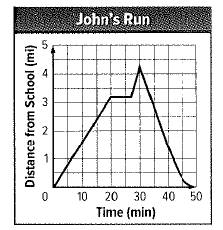
Practice run of Dante is described as, he leaves for high school and runs at a steady rate for 18 minutes until he reaches middle school which is about 3.2 miles away. He runs around 10 laps around the track in middle school in 14 minutes. Then he runs back to high school to complete 55 minute run.
Recall that the graph of a function is said to be linear is it is straight line. If it is a curve it is non-linear.
Observe that for both John and Dante the graph is non-linear. Total time by John is 50 minutes and by Dante is 55 minutes. Both reaches the middle school at the same time. John complete 10 laps around the track in middle school in 9 minutes.
Chapter 1 Solutions
Glencoe Algebra 1, Student Edition, 9780079039897, 0079039898, 2018
Additional Math Textbook Solutions
Pre-Algebra Student Edition
Elementary Statistics (13th Edition)
A Problem Solving Approach To Mathematics For Elementary School Teachers (13th Edition)
Elementary Statistics
Elementary Statistics: Picturing the World (7th Edition)
College Algebra (7th Edition)


- Can you check if my step is correct?arrow_forwardI need help explaining on this example on how can I define the Time-Domain Function, Apply the Laplace Transformation Formula, and Simplify to Find the Frequency-Domain Expression. I need to understand on finding Y(s)arrow_forwardI need help explaining on this example on how can I define the Time-Domain Function, Apply the Laplace Transformation Formula, andarrow_forward
- ma Classes Term. Spring 2025 Title Details Credit Hours CRN Schedule Type Grade Mode Level Date Status Message *MATHEMATICS FOR MANAGEME... MTH 245, 400 4 54835 Online Normal Grading Mode Ecampus Undergradu... 03/21/2025 Registered **Web Registered... *SOIL SCIENCE CSS 205, 400 0 52298 Online Normal Grading Mode Undergraduate 03/21/2025 Waitlisted Waitlist03/21/2025 PLANT PATHOLOGY BOT 451, 400 4 56960 Online Normal Grading Mode Undergraduate 03/21/2025 Registered **Web Registered... Records: 3 Schedule Schedule Detailsarrow_forwardHere is an augmented matrix for a system of equations (three equations and three variables). Let the variables used be x, y, and z: 1 2 4 6 0 1 -1 3 0 0 1 4 Note: that this matrix is already in row echelon form. Your goal is to use this row echelon form to revert back to the equations that this represents, and then to ultimately solve the system of equations by finding x, y and z. Input your answer as a coordinate point: (x,y,z) with no spaces.arrow_forward1 3 -4 In the following matrix perform the operation 2R1 + R2 → R2. -2 -1 6 After you have completed this, what numeric value is in the a22 position?arrow_forward
- 5 -2 0 1 6 12 Let A = 6 7 -1 and B = 1/2 3 -14 -2 0 4 4 4 0 Compute -3A+2B and call the resulting matrix R. If rij represent the individual entries in the matrix R, what numeric value is in 131? Input your answer as a numeric value only.arrow_forward1 -2 4 10 My goal is to put the matrix 5 -1 1 0 into row echelon form using Gaussian elimination. 3 -2 6 9 My next step is to manipulate this matrix using elementary row operations to get a 0 in the a21 position. Which of the following operations would be the appropriate elementary row operation to use to get a 0 in the a21 position? O (1/5)*R2 --> R2 ○ 2R1 + R2 --> R2 ○ 5R1+ R2 --> R2 O-5R1 + R2 --> R2arrow_forwardThe 2x2 linear system of equations -2x+4y = 8 and 4x-3y = 9 was put into the following -2 4 8 augmented matrix: 4 -3 9 This augmented matrix is then converted to row echelon form. Which of the following matrices is the appropriate row echelon form for the given augmented matrix? 0 Option 1: 1 11 -2 Option 2: 4 -3 9 Option 3: 10 ܂ -2 -4 5 25 1 -2 -4 Option 4: 0 1 5 1 -2 Option 5: 0 0 20 -4 5 ○ Option 1 is the appropriate row echelon form. ○ Option 2 is the appropriate row echelon form. ○ Option 3 is the appropriate row echelon form. ○ Option 4 is the appropriate row echelon form. ○ Option 5 is the appropriate row echelon form.arrow_forward
- Let matrix A have order (dimension) 2x4 and let matrix B have order (dimension) 4x4. What results when you compute A+B? The resulting matrix will have dimensions of 2x4. ○ The resulting matrix will be a single number (scalar). The resulting matrix will have dimensions of 4x4. A+B is undefined since matrix A and B do not have the same dimensions.arrow_forwardIf -1 "[a446]-[254] 4b = -1 , find the values of a and b. ○ There is no solution for a and b. ○ There are infinite solutions for a and b. O a=3, b=3 O a=1, b=2 O a=2, b=1 O a=2, b=2arrow_forwardA student puts a 3x3 system of linear equations is into an augmented matrix. The student then correctly puts the augmented matrix into row echelon form (REF), which yields the following resultant matrix: -2 3 -0.5 10 0 0 0 -2 0 1 -4 Which of the following conclusions is mathematically supported by the work shown about system of linear equations? The 3x3 system of linear equations has no solution. ○ The 3x3 system of linear equations has infinite solutions. The 3x3 system of linear equations has one unique solution.arrow_forward
 Algebra and Trigonometry (6th Edition)AlgebraISBN:9780134463216Author:Robert F. BlitzerPublisher:PEARSON
 Contemporary Abstract AlgebraAlgebraISBN:9781305657960Author:Joseph GallianPublisher:Cengage Learning
 Linear Algebra: A Modern IntroductionAlgebraISBN:9781285463247Author:David PoolePublisher:Cengage Learning
 Algebra And Trigonometry (11th Edition)AlgebraISBN:9780135163078Author:Michael SullivanPublisher:PEARSON
 Introduction to Linear Algebra, Fifth EditionAlgebraISBN:9780980232776Author:Gilbert StrangPublisher:Wellesley-Cambridge Press
 College Algebra (Collegiate Math)AlgebraISBN:9780077836344Author:Julie Miller, Donna GerkenPublisher:McGraw-Hill Education