
Videos
To identify: The whether the graph provided below is linear or not. Also compute and interpret the intercepts, symmetry, positive, negative, increasing, decreasing and the x -coordinate of any relative extrema and end the end behavior of the graph.

Answer to Problem 21PT
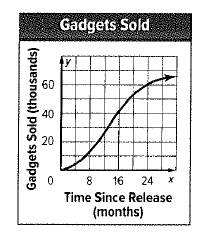
The graph is non-linear. The y -intercept
Explanation of Solution
Given information:
The graphical representation of number of number of gadgets sold in thousands over a period of time is provided below.
Formula used:
The graph of a function is said to be linear is it is straight line. If it is a curve it is non-linear.
The x- intercepts are the points on x -axis where the graph of the equation intersects the x -axis.
The y- intercepts are the points on y -axis where the graph of the equation intersects the y -axis.
When the graph of the function lies above the x -axis the function is said to be positive otherwise negative.
When the graph of the function goes up it is an increasing function when viewed from left to right otherwise function is decreasing.
The function has relative high and low values of function. A function has relative minimum when no other near by point has a lesser y -coordinate. A function has relative maximum when no other near by point has a greater y -coordinate.
End behavior of the graph represents the values of the function at positive and negative extremes in domain of the function.
Calculation:
Consider the graphical representation of number of number of gadgets sold in thousands over a period of time is provided below.

The x -axis denote the time in months and y -axis denote the number of gadgets sold in thousands.
Recall that the graph of a function is said to be linear is it is straight line. If it is a curve it is non-linear.
Observe that graph is not a straight line so it is a non-linear graph.
Also the graph of the function is not divided by any line into mirror images, so it is not symmetric also.
Recall that the x- intercepts are the points on x -axis where the graph of the equation intersects the x -axis.
Observe that the graph does intersect the x -axis at the origin so x- intercept is
The y- intercepts are the points on y -axis where the graph of the equation intersects the y -axis.
Observe that the graph intersects the y -axis at the point
Recall that when the graph of the function lies above the x -axis the function is said to be positive otherwise negative.
Observe that graph of the function always lie above the x -axisso the function is said to be positive that is number of gadgets sold is always a positive number.
Recall that when the graph of the function goes up it is an increasing function when viewed from left to right otherwise function is decreasing.
The graph of the function is always increasing for
Recall that the function has relative high and low values of function. A function has relative minimum when no other near by point has a lesser y -coordinate. A function has relative maximum when no other near by point has a greater y -coordinate.
There is neither relative maximum nor relative minimum.
Recall that the end behavior of the graph represents the values of the function at positive and negative extremes in domain of the function.
The graph describes the number gadgets sold. As the number of months increases the sale of gadgets also increases.
Chapter 1 Solutions
Glencoe Algebra 1, Student Edition, 9780079039897, 0079039898, 2018
Additional Math Textbook Solutions
Thinking Mathematically (6th Edition)
Pre-Algebra Student Edition
Elementary Statistics
Elementary Statistics: Picturing the World (7th Edition)
A Problem Solving Approach To Mathematics For Elementary School Teachers (13th Edition)
Calculus for Business, Economics, Life Sciences, and Social Sciences (14th Edition)


- Safari File Edit View History Bookmarks Window Help Ο Ω OV O mA 0 mW ర Fri Apr 4 1 222 tv A F9 F10 DII 4 F6 F7 F8 7 29 8 00 W E R T Y U S D பட 9 O G H J K E F11 + 11 F12 O P } [arrow_forwardSo confused. Step by step instructions pleasearrow_forwardIn simplest terms, Sketch the graph of the parabola. Then, determine its equation. opens downward, vertex is (- 4, 7), passes through point (0, - 39)arrow_forward
- In simplest way, For each quadratic relation, find the zeros and the maximum or minimum. a) y = x 2 + 16 x + 39 b) y = 5 x2 - 50 x - 120arrow_forwardIn simplest terms and step by step Write each quadratic relation in standard form, then fi nd the zeros. y = - 4( x + 6)2 + 36arrow_forwardIn simplest terms and step by step For each quadratic relation, find the zeros and the maximum or minimum. 1) y = - 2 x2 - 28 x + 64 2) y = 6 x2 + 36 x - 42arrow_forward
- Write each relation in standard form a)y = 5(x + 10)2 + 7 b)y = 9(x - 8)2 - 4arrow_forwardIn simplest form and step by step Write the quadratic relation in standard form, then fi nd the zeros. y = 3(x - 1)2 - 147arrow_forwardStep by step instructions The path of a soccer ball can be modelled by the relation h = - 0.1 d 2 + 0.5 d + 0.6, where h is the ball’s height and d is the horizontal distance from the kicker. a) Find the zeros of the relation.arrow_forward
 Algebra and Trigonometry (6th Edition)AlgebraISBN:9780134463216Author:Robert F. BlitzerPublisher:PEARSON
 Contemporary Abstract AlgebraAlgebraISBN:9781305657960Author:Joseph GallianPublisher:Cengage Learning
 Linear Algebra: A Modern IntroductionAlgebraISBN:9781285463247Author:David PoolePublisher:Cengage Learning
 Algebra And Trigonometry (11th Edition)AlgebraISBN:9780135163078Author:Michael SullivanPublisher:PEARSON
 Introduction to Linear Algebra, Fifth EditionAlgebraISBN:9780980232776Author:Gilbert StrangPublisher:Wellesley-Cambridge Press
 College Algebra (Collegiate Math)AlgebraISBN:9780077836344Author:Julie Miller, Donna GerkenPublisher:McGraw-Hill Education