General, Organic, & Biological Chemistry
3rd Edition
ISBN: 9780073511245
Author: Janice Gorzynski Smith Dr.
Publisher: McGraw-Hill Education
expand_more
expand_more
format_list_bulleted
Concept explainers
Question
Chapter 18, Problem 18.66P
Interpretation Introduction
Interpretation:
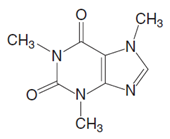
Reason to limit the caffeine intake of pregnant and nursing mothers needs to be explained.
Concept Introduction:
Caffeine is an alkaloid present naturally in plant sources such as coffee beans and tea leaves.
As seen in the structure of caffeine, it contains
Expert Solution & Answer
Want to see the full answer?
Check out a sample textbook solution
Students have asked these similar questions
help
The temperature on a sample of pure X held at 1.25 atm and -54. °C is increased until the sample boils. The temperature is then held constant and the
pressure is decreased by 0.42 atm. On the phase diagram below draw a path that shows this set of changes.
pressure (atm)
2
0
0
200
400
temperature (K)
X
QUESTION: Answer Question 5: 'Calculating standard error of regression' STEP 1 by filling in all the empty green boxes
*The values are all provided in the photo attached*
Chapter 18 Solutions
General, Organic, & Biological Chemistry
Ch. 18.1 - Prob. 18.1PCh. 18.1 - Prob. 18.2PCh. 18.1 - Prob. 18.3PCh. 18.1 - Prob. 18.4PCh. 18.2 - Prob. 18.5PCh. 18.2 - Prob. 18.6PCh. 18.2 - Prob. 18.7PCh. 18.3 - Prob. 18.8PCh. 18.4 - Decaffeinated coffee is produced by extracting the...Ch. 18.4 - Prob. 18.10P
Ch. 18.5 - Prob. 18.11PCh. 18.5 - Prob. 18.12PCh. 18.5 - Prob. 18.13PCh. 18.6 - Prob. 18.14PCh. 18.6 - Prob. 18.15PCh. 18.6 - Prob. 18.16PCh. 18.6 - Name each ammonium salt. a. ( CH3 NH3)+Cl b. [( CH...Ch. 18.6 - Prob. 18.18PCh. 18.6 - Prob. 18.19PCh. 18.7 - Prob. 18.20PCh. 18.7 - Prob. 18.21PCh. 18.8 - Prob. 18.22PCh. 18.8 - Prob. 18.23PCh. 18.8 - Prob. 18.24PCh. 18.9 - Prob. 18.25PCh. 18.9 - Prob. 18.26PCh. 18.9 - Prob. 18.27PCh. 18.10 - Prob. 18.28PCh. 18 - Prob. 18.29PCh. 18 - Prob. 18.30PCh. 18 - Prob. 18.31PCh. 18 - Prob. 18.32PCh. 18 - Prob. 18.33PCh. 18 - Prob. 18.34PCh. 18 - Prob. 18.35PCh. 18 - Prob. 18.36PCh. 18 - Prob. 18.37PCh. 18 - Prob. 18.38PCh. 18 - Give an acceptable name for each amine. a. b.Ch. 18 - Give an acceptable name for each amine. a. b.Ch. 18 - Give an acceptable name for each amine. a. b. c....Ch. 18 - Give an acceptable name for each amine. a. CH3(...Ch. 18 - Prob. 18.43PCh. 18 - Prob. 18.44PCh. 18 - Prob. 18.45PCh. 18 - Prob. 18.46PCh. 18 - Prob. 18.47PCh. 18 - Prob. 18.48PCh. 18 - Prob. 18.49PCh. 18 - Prob. 18.50PCh. 18 - Which compound in each pair has the higher boiling...Ch. 18 - Which compound in each pair has the higher boiling...Ch. 18 - Draw the hydrogen-bonding interactions that occur...Ch. 18 - Prob. 18.54PCh. 18 - Prob. 18.55PCh. 18 - Which compound has the higher water solubility:...Ch. 18 - Prob. 18.57PCh. 18 - Prob. 18.58PCh. 18 - Draw the products of each acid-base reaction. a....Ch. 18 - Draw the products of each acid-base reaction. a....Ch. 18 - Prob. 18.61PCh. 18 - Prob. 18.62PCh. 18 - What type of nitrogen heterocycle occurs in both...Ch. 18 - Only one of the N atoms in nicotine has a trigonal...Ch. 18 - Prob. 18.65PCh. 18 - Prob. 18.66PCh. 18 - Why are aqueous solutions of an alkaloid slightly...Ch. 18 - Prob. 18.68PCh. 18 - Prob. 18.69PCh. 18 - Explain why patients with Parkinson’s disease...Ch. 18 - Prob. 18.71PCh. 18 - Prob. 18.72PCh. 18 - Prob. 18.73PCh. 18 - Prob. 18.74PCh. 18 - Prob. 18.75PCh. 18 - Prob. 18.76PCh. 18 - Prob. 18.77PCh. 18 - Prob. 18.78PCh. 18 - Prob. 18.79PCh. 18 - Prob. 18.80PCh. 18 - Prob. 18.81PCh. 18 - Prob. 18.82PCh. 18 - Prob. 18.83PCh. 18 - Prob. 18.84PCh. 18 - Prob. 18.85PCh. 18 - Prob. 18.86PCh. 18 - Prob. 18.87PCh. 18 - Why do some antihistamines cause drowsiness while...Ch. 18 - Prob. 18.89PCh. 18 - Prob. 18.90PCh. 18 - Compare the structures of morphine and heroin....Ch. 18 - Prob. 18.92CP
Knowledge Booster


Learn more about
Need a deep-dive on the concept behind this application? Look no further. Learn more about this topic, chemistry and related others by exploring similar questions and additional content below.Similar questions
- pressure (atm) 3 The pressure on a sample of pure X held at 47. °C and 0.88 atm is increased until the sample condenses. The pressure is then held constant and the temperature is decreased by 82. °C. On the phase diagram below draw a path that shows this set of changes. 0 0 200 temperature (K) 400 аarrow_forwarder your payment details | bar xb Home | bartleby x + aleksogi/x/isl.exe/1o u-lgNskr7j8P3jH-1Qs_pBanHhviTCeeBZbufuBYT0Hz7m7D3ZcW81NC1d8Kzb4srFik1OUFhKMUXzhGpw7k1 O States of Matter Sketching a described thermodynamic change on a phase diagram 0/5 The pressure on a sample of pure X held at 47. °C and 0.88 atm is increased until the sample condenses. The pressure is then held constant and the temperature is decreased by 82. °C. On the phase diagram below draw a path that shows this set of changes. pressure (atm) 1 3- 0- 0 200 Explanation Check temperature (K) 400 X Q Search L G 2025 McGraw Hill LLC. All Rights Reserved Terms of Use Privacy Cearrow_forward5.arrow_forward
- 6.arrow_forward0/5 alekscgi/x/sl.exe/1o_u-IgNglkr7j8P3jH-IQs_pBaHhvlTCeeBZbufuBYTi0Hz7m7D3ZcSLEFovsXaorzoFtUs | AbtAURtkqzol 1HRAS286, O States of Matter Sketching a described thermodynamic change on a phase diagram The pressure on a sample of pure X held at 47. °C and 0.88 atm is increased until the sample condenses. The pressure is then held constant and the temperature is decreased by 82. °C. On the phase diagram below draw a path that shows this set of changes. 3 pressure (atm) + 0- 0 5+ 200 temperature (K) 400 Explanation Check X 0+ F3 F4 F5 F6 F7 S 2025 McGraw Hill LLC All Rights Reserved. Terms of Use Privacy Center Accessibility Q Search LUCR + F8 F9 F10 F11 F12 * % & ( 5 6 7 8 9 Y'S Dele Insert PrtSc + Backsarrow_forward5.arrow_forward
- 9arrow_forwardalekscgi/x/lsl.exe/1o_u-IgNslkr7j8P3jH-IQs_pBanHhvlTCeeBZbufu BYTI0Hz7m7D3ZS18w-nDB10538ZsAtmorZoFusYj2Xu9b78gZo- O States of Matter Sketching a described thermodynamic change on a phase diagram 0/5 The pressure on a sample of pure X held at 47. °C and 0.88 atm is increased until the sample condenses. The pressure is then held constant and the temperature is decreased by 82. °C. On the phase diagram below draw a path that shows this set of changes. pressure (atm) 3- 200 temperature (K) Explanation Chick Q Sowncharrow_forward0+ aleksog/x/lsl.exe/1ou-lgNgkr7j8P3H-IQs pBaHhviTCeeBZbufuBYTOHz7m7D3ZStEPTBSB3u9bsp3Da pl19qomOXLhvWbH9wmXW5zm O States of Matter Sketching a described thermodynamic change on a phase diagram 0/5 Gab The temperature on a sample of pure X held at 0.75 atm and -229. °C is increased until the sample sublimes. The temperature is then held constant and the pressure is decreased by 0.50 atm. On the phase diagram below draw a path that shows this set of changes. F3 pressure (atm) 0- 0 200 Explanation temperature (K) Check F4 F5 ☀+ Q Search Chill Will an 9 ENG F6 F7 F8 F9 8 Delete F10 F11 F12 Insert PrtSc 114 d Ararrow_forward
- x + LEKS: Using a phase diagram a X n/alekscgi/x/lsl.exe/10_u-IgNsikr7j8P3jH-IQs_pBan HhvlTCeeBZbufu BYTI0Hz7m7D3ZcHYUt80XL-5alyVpw ○ States of Matter Using a phase diagram to find a phase transition temperature or pressure Use the phase diagram of Substance X below to find the melting point of X when the pressure above the solid is 1.1 atm. pressure (atm) 16 08- solid liquid- 0 200 400 gas 600 temperature (K) Note: your answer must be within 25 °C of the exact answer to be graded correct. × 5arrow_forwardS: Using a phase diagram leksogi/x/sl.exe/1ou-IgNs kr 7j8P3jH-IQs_pBan HhvTCeeBZbufuBYTI0Hz7m7D3ZdHYU+80XL-5alyVp O States of Matter Using a phase diagram to find a phase transition temperature or pressure se the phase diagram of Substance X below to find the boiling point of X when the pressure on the liquid is 1.6 atm. pressure (atm) 32- 16- solid liquid 0. gas 100 200 temperature (K) 300 Note: your answer must be within 12.5 °C of the exact answer to be graded correct. 10 Explanation Check § Q Search J 2025 McGraw Hill LLC. All Rights Researrow_forward151.2 254.8 85.9 199.6 241.4 87.6 242.5 186.4 155.8 257.1 242.9 253.3 256.0 216.6 108.7 239.0 149.7 236.4 152.1 222.7 148.7 278.2 268.7 234.4 262.7 283.2 143.6 QUESTION: Using this group of data on salt reduced tomato sauce concentration readings answer the following questions: 1. 95% Cl Confidence Interval (mmol/L) 2. [Na+] (mg/100 mL) 3. 95% Na+ Confidence Interval (mg/100 mL)arrow_forward
arrow_back_ios
SEE MORE QUESTIONS
arrow_forward_ios
Recommended textbooks for you
 Chemistry for Today: General, Organic, and Bioche...ChemistryISBN:9781305960060Author:Spencer L. Seager, Michael R. Slabaugh, Maren S. HansenPublisher:Cengage Learning
 EBK A SMALL SCALE APPROACH TO ORGANIC LChemistryISBN:9781305446021Author:LampmanPublisher:CENGAGE LEARNING - CONSIGNMENT
 General, Organic, and Biological ChemistryChemistryISBN:9781285853918Author:H. Stephen StokerPublisher:Cengage Learning
 Organic And Biological ChemistryChemistryISBN:9781305081079Author:STOKER, H. Stephen (howard Stephen)Publisher:Cengage Learning,
Chemistry for Today: General, Organic, and Bioche...
Chemistry
ISBN:9781305960060
Author:Spencer L. Seager, Michael R. Slabaugh, Maren S. Hansen
Publisher:Cengage Learning
EBK A SMALL SCALE APPROACH TO ORGANIC L
Chemistry
ISBN:9781305446021
Author:Lampman
Publisher:CENGAGE LEARNING - CONSIGNMENT
General, Organic, and Biological Chemistry
Chemistry
ISBN:9781285853918
Author:H. Stephen Stoker
Publisher:Cengage Learning
Organic And Biological Chemistry
Chemistry
ISBN:9781305081079
Author:STOKER, H. Stephen (howard Stephen)
Publisher:Cengage Learning,