
Introduction to Statistics and Data Analysis
5th Edition
ISBN: 9781305115347
Author: Roxy Peck; Chris Olsen; Jay L. Devore
Publisher: Brooks Cole
expand_more
expand_more
format_list_bulleted
Concept explainers
Videos
Textbook Question
Chapter 13.3, Problem 32E
An investigation of the relationship between x = Traffic flow (thousands of cars per 24 hours) and y = Lead content of bark on trees near the highway (mg/g dry weight) yielded the accompanying data. A simple linear regression model was fit, and the resulting estimated regression line was ŷ = 28.7 + 33.3x. Both residuals and standardized residuals are also given.
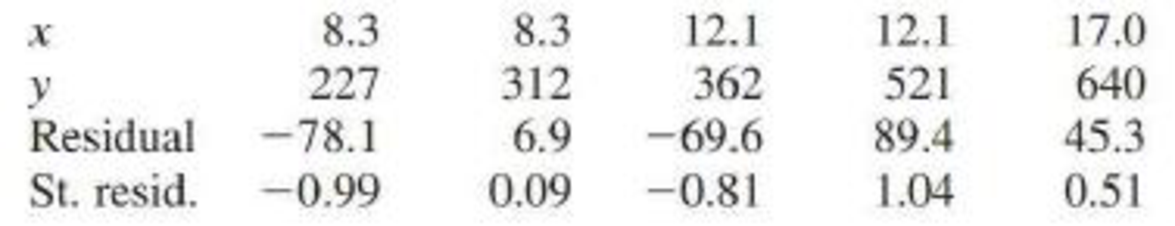
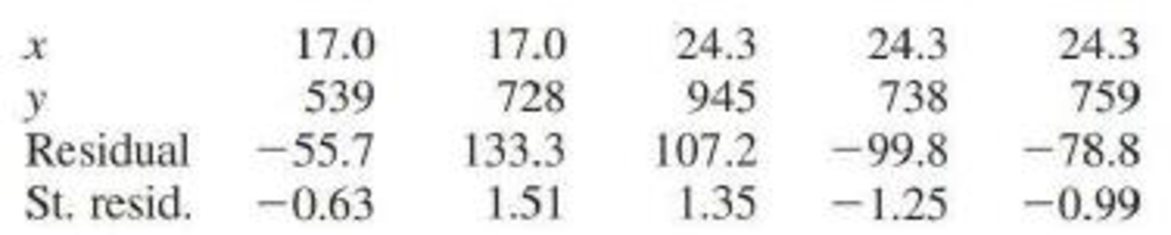
- a. Plot the (x, residual) pairs. Does the resulting plot suggest that a simple linear regression model is an appropriate choice? Explain.
- b. Construct a standardized residual plot. Does the plot differ significantly in general appearance from the plot in Part (a)?
Expert Solution & Answer

Trending nowThis is a popular solution!

Students have asked these similar questions
At a fish market, different measurements of a certain type of fish were recorded for a sample of 35 fish. An analysist used the data to
develop a linear model of the relationship between the weight (in grams) of the fish, and its length, height and width (all in cm). The
results of the multiple linear regression to predict the weight of the fish are as follows:
Regression Statistics
Multiple R
R Square
0.971
0.943
Adjusted R Square
0.937
Standard Error
52.428
Observations
35
df
Significance F
ANOVA
MS
F
Regression
3
1402868
467622.7
170.1224
0.0000
Residual
31
85211
2748.742
Total
34
1488079
Coefficients
Standard Error
t Stat
P-value
-13.2
Intercept
Length
-1009.0
76.5
0.0000
12.8
7.5
1.7
0.0971
Height
63.1
15.9
3.9
0.0004
Width
51.6
34.0
1.5
0.1391
1. What percentage of variation in weight is not explained by the regression model? Give your
answer correct to 1 decimal place.
2. Use the ANOVA p-value to test the appropriate hypothesis at the 5% level of significance. For each one of…
Draw the regression line for the following equation:
Y = -3 + (1) X
Show your calculation for a low and high value on the predictor value.
An agent for a real estate company in a large city would like to be able to predict the monthly rental cost for apartments, based on the size of the apartment, as defined by square footage. A sample of eight apartments in a
neighborhood was selected, and the information gathered revealed the data shown below. For these data, the regression coefficients are b, = 89.7175 and b, = 1.0703. Complete parts (a) through (d).
Monthly Rent (S)
Size (Square Feet)
900 1,450
850
1,500 2,000 900
1,825 1,300 o
850
1,350
950
1,200 1,900 700
1.350 1.050
.....
a. Determine the coefficient of determination, r, and interpret its meaning.
2= 0.843 (Round to three decimal places as needed.)
What is the meaning of ?
O A. r measures the proportion of variation in apartment size that can be explained by the variation in monthly rent.
O B. r measures the proportion of variation in apartment size that cannot be explained by the variation in monthly rent.
O C. measures the proportion of variation in monthly rent…
Chapter 13 Solutions
Introduction to Statistics and Data Analysis
Ch. 13.1 - Prob. 1ECh. 13.1 - The flow rate in a device used for air quality...Ch. 13.1 - The paper Predicting Yolk Height, Yolk Width,...Ch. 13.1 - Prob. 4ECh. 13.1 - Suppose that a simple linear regression model is...Ch. 13.1 - a. Explain the difference between the line y x...Ch. 13.1 - Prob. 7ECh. 13.1 - Hormone replacement therapy (HRT) is thought to...Ch. 13.1 - Prob. 9ECh. 13.1 - A simple linear regression model was used to...
Ch. 13.1 - Consider the accompanying data on x = Advertising...Ch. 13.2 - What is the difference between and b? What is the...Ch. 13.2 - The largest commercial fishing enterprise in the...Ch. 13.2 - Prob. 14ECh. 13.2 - Prob. 15ECh. 13.2 - Prob. 16ECh. 13.2 - An experiment to study the relationship between x...Ch. 13.2 - The paper The Effects of Split Keyboard Geometry...Ch. 13.2 - The authors of the paper Decreased Brain Volume in...Ch. 13.2 - Do taller adults make more money? The authors of...Ch. 13.2 - Researchers studying pleasant touch sensations...Ch. 13.2 - Prob. 22ECh. 13.2 - Prob. 23ECh. 13.2 - Consider the accompanying data on x = Research and...Ch. 13.2 - Prob. 25ECh. 13.2 - In anthropological studies, an important...Ch. 13.3 - The graphs accompanying this exercise are based on...Ch. 13.3 - Prob. 28ECh. 13.3 - Prob. 29ECh. 13.3 - The article Vital Dimensions in Volume Perception:...Ch. 13.3 - Prob. 31ECh. 13.3 - An investigation of the relationship between x =...Ch. 13.4 - Prob. 33ECh. 13.4 - Prob. 34ECh. 13.4 - Prob. 35ECh. 13.4 - Prob. 36ECh. 13.4 - A subset of data read from a graph that appeared...Ch. 13.4 - Prob. 38ECh. 13.4 - Prob. 39ECh. 13.4 - Prob. 40ECh. 13.4 - The shelf life of packaged food depends on many...Ch. 13.4 - For the cereal data of the previous exercise, the...Ch. 13.4 - The article Performance Test Conducted for a Gas...Ch. 13.5 - Prob. 44ECh. 13.5 - Prob. 45ECh. 13.5 - A sample of n = 353 college faculty members was...Ch. 13.5 - Prob. 47ECh. 13.5 - Prob. 48ECh. 13.5 - The accompanying summary quantities for x =...Ch. 13.5 - Prob. 50ECh. 13.5 - Prob. 51ECh. 13.6 - Prob. 52ECh. 13 - Prob. 53CRCh. 13 - Prob. 54CRCh. 13 - Prob. 55CRCh. 13 - The article Photocharge Effects in Dye Sensitized...Ch. 13 - Prob. 57CRCh. 13 - Prob. 58CRCh. 13 - Prob. 59CRCh. 13 - Prob. 60CRCh. 13 - Prob. 61CRCh. 13 - The article Improving Fermentation Productivity...Ch. 13 - Prob. 63CRCh. 13 - Prob. 64CRCh. 13 - Prob. 65CRCh. 13 - Prob. 1CRECh. 13 - Prob. 2CRECh. 13 - Prob. 3CRECh. 13 - Prob. 4CRECh. 13 - Prob. 5CRECh. 13 - The accompanying graphical display is similar to...Ch. 13 - Prob. 7CRECh. 13 - Prob. 8CRECh. 13 - Consider the following data on y = Number of songs...Ch. 13 - Many people take ginkgo supplements advertised to...Ch. 13 - Prob. 11CRECh. 13 - Prob. 12CRECh. 13 - Prob. 13CRECh. 13 - Prob. 14CRECh. 13 - The discharge of industrial wastewater into rivers...Ch. 13 - Many people take ginkgo supplements advertised to...Ch. 13 - It is hypothesized that when homing pigeons are...Ch. 13 - Prob. 18CRE
Knowledge Booster


Learn more about
Need a deep-dive on the concept behind this application? Look no further. Learn more about this topic, statistics and related others by exploring similar questions and additional content below.Similar questions
- Life Expectancy The following table shows the average life expectancy, in years, of a child born in the given year42 Life expectancy 2005 77.6 2007 78.1 2009 78.5 2011 78.7 2013 78.8 a. Find the equation of the regression line, and explain the meaning of its slope. b. Plot the data points and the regression line. c. Explain in practical terms the meaning of the slope of the regression line. d. Based on the trend of the regression line, what do you predict as the life expectancy of a child born in 2019? e. Based on the trend of the regression line, what do you predict as the life expectancy of a child born in 1580?2300arrow_forwardXYZ Corporation Stock Prices The following table shows the average stock price, in dollars, of XYZ Corporation in the given month. Month Stock price January 2011 43.71 February 2011 44.22 March 2011 44.44 April 2011 45.17 May 2011 45.97 a. Find the equation of the regression line. Round the regression coefficients to three decimal places. b. Plot the data points and the regression line. c. Explain in practical terms the meaning of the slope of the regression line. d. Based on the trend of the regression line, what do you predict the stock price to be in January 2012? January 2013?arrow_forwardFor the following exercises, consider the data in Table 5, which shows the percent of unemployed in a city ofpeople25 years or older who are college graduates is given below, by year. 41. Based on the set of data given in Table 7, calculatethe regression line using a calculator or othertechnology tool, and determine the correlationcoefficient to three decimal places.arrow_forward
- Olympic Pole Vault The graph in Figure 7 indicates that in recent years the winning Olympic men’s pole vault height has fallen below the value predicted by the regression line in Example 2. This might have occurred because when the pole vault was a new event there was much room for improvement in vaulters’ performances, whereas now even the best training can produce only incremental advances. Let’s see whether concentrating on more recent results gives a better predictor of future records. (a) Use the data in Table 2 (page 176) to complete the table of winning pole vault heights shown in the margin. (Note that we are using x=0 to correspond to the year 1972, where this restricted data set begins.) (b) Find the regression line for the data in part ‚(a). (c) Plot the data and the regression line on the same axes. Does the regression line seem to provide a good model for the data? (d) What does the regression line predict as the winning pole vault height for the 2012 Olympics? Compare this predicted value to the actual 2012 winning height of 5.97 m, as described on page 177. Has this new regression line provided a better prediction than the line in Example 2?arrow_forwardFor the following exercises, use Table 4 which shows the percent of unemployed persons 25 years or older who are college graduates in a particular city, by year. Based on the set of data given in Table 5, calculate the regression line using a calculator or other technology tool, and determine the correlation coefficient. Round to three decimal places of accuracyarrow_forwardFor the following exercises, consider the data in Table 5, which shows the percent of unemployed ina city of people 25 years or older who are college graduates is given below, by year. 40. Based on the set of data given in Table 6, calculate the regression line using a calculator or other technology tool, and determine the correlation coefficient to three decimal places.arrow_forward
- What does the y -intercept on the graph of a logistic equation correspond to for a population modeled by that equation?arrow_forwardb. What does the scatter diagram developed in part (a) indicate about the relationship between the two variables? The scatter diagram indicates a positive ✔✔✔ linear relationship between the hotel room rate and the amount spent on entertainment. c. Develop the least squares estimated regression equation. Entertainment = 18.2594 X + 1.0272 Room Rate (to 4 decimals) d. Provide an interpretation for the slope of the estimated regression equation (to 3 decimals). The slope of the estimated regression line is approximately 1.027 So, for every dollar increase ♥ e. The average room rate in Chicago is $128, considerably higher than the U.S. average. Predict the entertainment expense per day for Chicago (to whole number). $ 150 in the hotel room rate the amount spent on entertainment increases by $1.027arrow_forwardA simple linear regression model was created to examine the relationship between the age of patients (i.e. the independent variable) and the patients' scores on a questionnaire that measures quality of life (i.e. the dependent variable). There were n=20 patients in the study, and some of the results of the regression are presented below: Estimated intercept = 42 Standard error of the intercept = 13.6 Estimated slope = -0.64 Standard error of the slope = 0.52 Based on these results, which of the following can we conclude, based on an alpha level of 0.05 for significance? Question 16 options: The intercept is not significantly different from 0, but the slope is significantly different than 0. Thus, we have mixed results and we cannot make a definitive statement about the significance of the association. There is a significant association, because the intercept is statistically significantly different than 0 (p<0.05). There is not a…arrow_forward
- Louis Katz, a cost accountant at Papalote Plastics, Inc. (PPI), is analyzing the manufacturing costs of a molded plastic telephone handset produced by PPI. Louis's independent variable is production lot size (in 1,000's of units), and his dependent variable is the total cost of the lot (in $100's). Regression analysis of the data yielded the following tables. Intercept Source Coefficients Total df 11 3.996 SS F Regression 1 9.858769 9.858769 12.22345 Residual 8.872 0.806545 0.358 Save for Later Standard Error Using a=0.05, Louis should 12 18.73077 O suspend judgment O not reject Ho: Po=0 O reject Ho: 1₁=0 O increase the sample size O not reject Ho: 1-0 p-value 1.161268 3.441065 0.004885 0.102397 3.496205 0.004413 t Statistic MS Se = 0.898 r² = 0.526341arrow_forwardThe accompanying table shows results from regressions performed on data from a random sample of 21 cars. The response (y) variable is CITY (fuel consumption in mi/gal). The predictor (x) variables are WT (weight in pounds), DISP (engine displacement in liters), and HWY (highway fuel consumption in mi/gal). Which regression equation is best for predicting city fuel consumption? Why? E Click the icon to view the table of regression equations. Choose the correct answer below. O A. The equation CITY = 6.65 - 0.00161WT + 0.675HWY is best because it has a low P-value and the highest adjusted value of R2. O B. The equation CITY = 6.83 - 0.00132WT - 0.253DISP + 0.654HWY is best because it has a low P-value and the highest value of R?. OC. The equation CITY = 6.83 - 0.00132WT - 0.253DISP + 0.654HWY is best because it uses all of the available predictor variables. O D. The equation CITY = - 3.14 + 0.823HWY is best because it has a low P-value and its R2 and adjusted R? values are comparable to…arrow_forwardType the regression equation for “Area” and “Biomass” in context into your document. Interpret the slope of the regression line (in context of this data set) for “Area” and “Biomass”. is it meaningful to interpret the y-intercept for “Area” and “Biomass”? Why or why not?arrow_forward
arrow_back_ios
SEE MORE QUESTIONS
arrow_forward_ios
Recommended textbooks for you
 Functions and Change: A Modeling Approach to Coll...AlgebraISBN:9781337111348Author:Bruce Crauder, Benny Evans, Alan NoellPublisher:Cengage Learning
 Glencoe Algebra 1, Student Edition, 9780079039897...AlgebraISBN:9780079039897Author:CarterPublisher:McGraw Hill

 College AlgebraAlgebraISBN:9781305115545Author:James Stewart, Lothar Redlin, Saleem WatsonPublisher:Cengage Learning
 Algebra and Trigonometry (MindTap Course List)AlgebraISBN:9781305071742Author:James Stewart, Lothar Redlin, Saleem WatsonPublisher:Cengage Learning
Functions and Change: A Modeling Approach to Coll...
Algebra
ISBN:9781337111348
Author:Bruce Crauder, Benny Evans, Alan Noell
Publisher:Cengage Learning
Glencoe Algebra 1, Student Edition, 9780079039897...
Algebra
ISBN:9780079039897
Author:Carter
Publisher:McGraw Hill
College Algebra
Algebra
ISBN:9781305115545
Author:James Stewart, Lothar Redlin, Saleem Watson
Publisher:Cengage Learning
Algebra and Trigonometry (MindTap Course List)
Algebra
ISBN:9781305071742
Author:James Stewart, Lothar Redlin, Saleem Watson
Publisher:Cengage Learning
Correlation Vs Regression: Difference Between them with definition & Comparison Chart; Author: Key Differences;https://www.youtube.com/watch?v=Ou2QGSJVd0U;License: Standard YouTube License, CC-BY
Correlation and Regression: Concepts with Illustrative examples; Author: LEARN & APPLY : Lean and Six Sigma;https://www.youtube.com/watch?v=xTpHD5WLuoA;License: Standard YouTube License, CC-BY