
Concept explainers
Videos
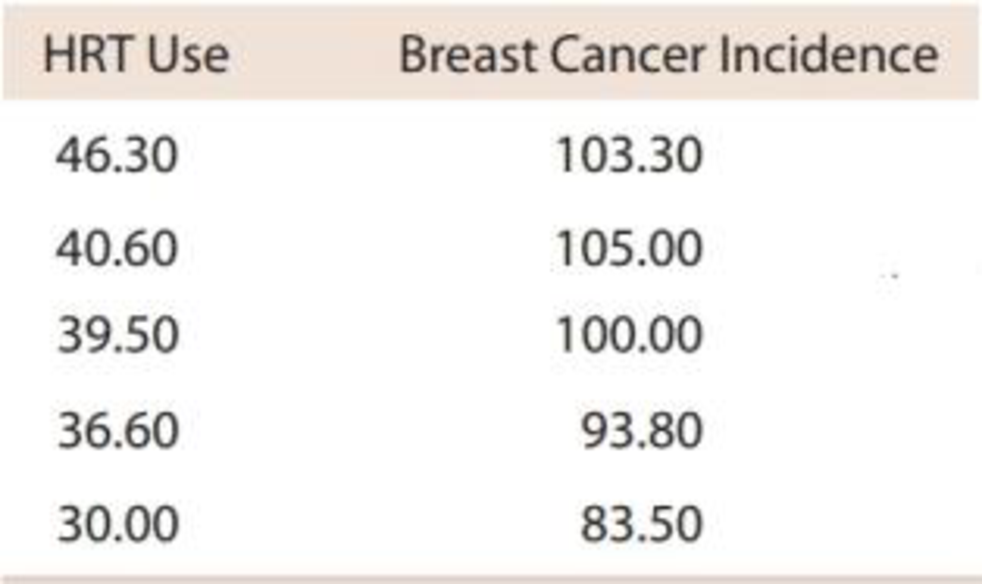
Hormone replacement therapy (HRT) is thought to increase the risk of breast cancer. The accompanying data on
x = percent of women using HRT
and
y = breast cancer incidence (cases per 100,000 women) for a region in Germany for 5 years appeared in the paper “Decline in Breast Cancer Incidence after Decrease in Utilisation of Hormone Replacement Therapy” (Epidemiology [2008]: 427–430). The authors of the paper used a simple linear regression model to describe the relationship between HRT use and breast cancer incidence.
a. What is the equation of the estimated regression line?
b. What is the estimated average change in breast cancer incidence associated with a 1 percentage point increase in HRT use?
c. What would you predict the breast cancer incidence to be in a year when HRT use was 40%?
d. Should you use this regression model to predict breast cancer incidence for a year when HRT use was 20%? Explain.
e. Calculate and interpret the value of r2.
f. Calculate and interpret the value of se.
Want to see the full answer?
Check out a sample textbook solution
Chapter 13 Solutions
Introduction to Statistics and Data Analysis


- 3 (Sharpe-ratio) Suppose that X1, X2,..., is a lognormal geometric random walk with parameters (μ, o²). Specifically, suppose that X = Xo exp(rı + ...Tk), where Xo is a fixed constant and r1, T2, ... are IID N(μ, o²). Find the Sharpe-ratios of rk and log(Xk) — log(Xo) respectively, assuming the risk free return is 0.arrow_forwardi need help with question 2arrow_forward4 (Value-at-Risk and Expected Shortfall) Suppose X Find VaR0.02(X) and ES0.02 (X). ~ Uniform(-1, 1).arrow_forward
- 亚 ח Variables Name avgdr employ educ exerany Label AVG ALCOHOLIC DRINKS PER DAY IN PAST 30 EMPLOYMENT STATUS EDUCATION LEVEL EXERCISE IN PAST 30 DAYSarrow_forwardVariables Name wage hours IQ KWW educ exper tenure age married black south urban sibs brthord meduc feduc Label monthly earnings average weekly hours IQ score knowledge of world work score years of education years of work experience years with current employer age in years =1 if married =1 if black =1 if live in south =1 if live in SMSA number of siblings birth order mother's education father's educationarrow_forwardInformation for questions 4 • • Please Download "wages" from Canvas (the link to this dataset is right below the HWA1 questions - it is a Microsoft excel worksheet) and store it in your favorite folder. It contains 797 observations and 16 variables. The "state" variable gives the names of the states involved in this dataset. • You need to have excel on your computer to open this dataset. i. You should use File > Import > Excel Spreadsheet etc. as done in class 3 convert this file into a Stata dataset. Once you are done, write the final STATA code that makes the transformation of an excel file to a STATA file possible. ii. Write a code that will close the log file that has been open since Question 1 part ii.arrow_forward
- The mean, variance, skewness and kurtosis of a dataset are given as - Mean = 15, Variance = 20, SKewness = 1.5 and Kurtosis = 3.5 calculate the first four raw moments. (Note- Please include as much detailed solution/steps in the solution to understand, Thank you!)arrow_forwardWrite codes to perform the functions in each of these cases i. ii. Apply cd command to tell STATA the filepath associated with your "favorite folder" (use the same name for the favorite folder that we have been using in class) Apply log using command to tell stata that you are creating a log file to record the codes and the outcomes of these codes. Make sure your log file is called loghwa1_W25.smcl. Do not forget to include the replace option. iii. Get help for the "regress" command & include a screenshot of the outcome of this code iv. V. Open a stata file stored in STATA memory called pop2000.dta Continue from question iv. Save this file in your favorite folder (current working directory) using a different name & a replace optionarrow_forwardAre there any unusually high or low pH levels in this sample of wells?arrow_forward
- 0 n AM RIES s of of 10 m Frequency 40 Frequency 20 20 30 10 You make two histograms from two different data sets (see the following figures), each one containing 200 observations. Which of the histograms has a smaller spread: the first or the second? 40 30 20 10 0 20 40 60 0 20 20 40 60 60 80 80 100 80 100arrow_forwardTIP the aren't, the data are not sym 11 Suppose that the average salary at a certain company is $100,000, and the median salary is $40,000. a. What do these figures tell you about the shape of the histogram of salaries at this company? b. Which measure of center is more appro- priate here? c. Suppose that the company goes through a salary negotiation. How can people on each side use these summary statistics to their advantage? 6360 be 52 PART 1 Getting Off to a Statistically Significant Sarrow_forward12 Suppose that you know that a data set is skewed left, and you know that the two measures of center are 19 and 38. Which figure is the mean and which is the median?arrow_forward
 Big Ideas Math A Bridge To Success Algebra 1: Stu...AlgebraISBN:9781680331141Author:HOUGHTON MIFFLIN HARCOURTPublisher:Houghton Mifflin Harcourt
 Glencoe Algebra 1, Student Edition, 9780079039897...AlgebraISBN:9780079039897Author:CarterPublisher:McGraw Hill
 Functions and Change: A Modeling Approach to Coll...AlgebraISBN:9781337111348Author:Bruce Crauder, Benny Evans, Alan NoellPublisher:Cengage Learning
 College AlgebraAlgebraISBN:9781305115545Author:James Stewart, Lothar Redlin, Saleem WatsonPublisher:Cengage Learning