
Introduction to Statistics and Data Analysis
5th Edition
ISBN: 9781305115347
Author: Roxy Peck; Chris Olsen; Jay L. Devore
Publisher: Brooks Cole
expand_more
expand_more
format_list_bulleted
Concept explainers
Videos
Textbook Question
Chapter 13.3, Problem 30E
The article “Vital Dimensions in Volume Perception: Can the Eye Fool the Stomach?” (Journal of Marketing Research [1999]: 313–326) gave the accompanying data on the dimensions of 27 representative food products (Gerber baby food, Cheez Whiz, Skippy Peanut Butter, and Ahmed’s tandoori paste, to name a few).
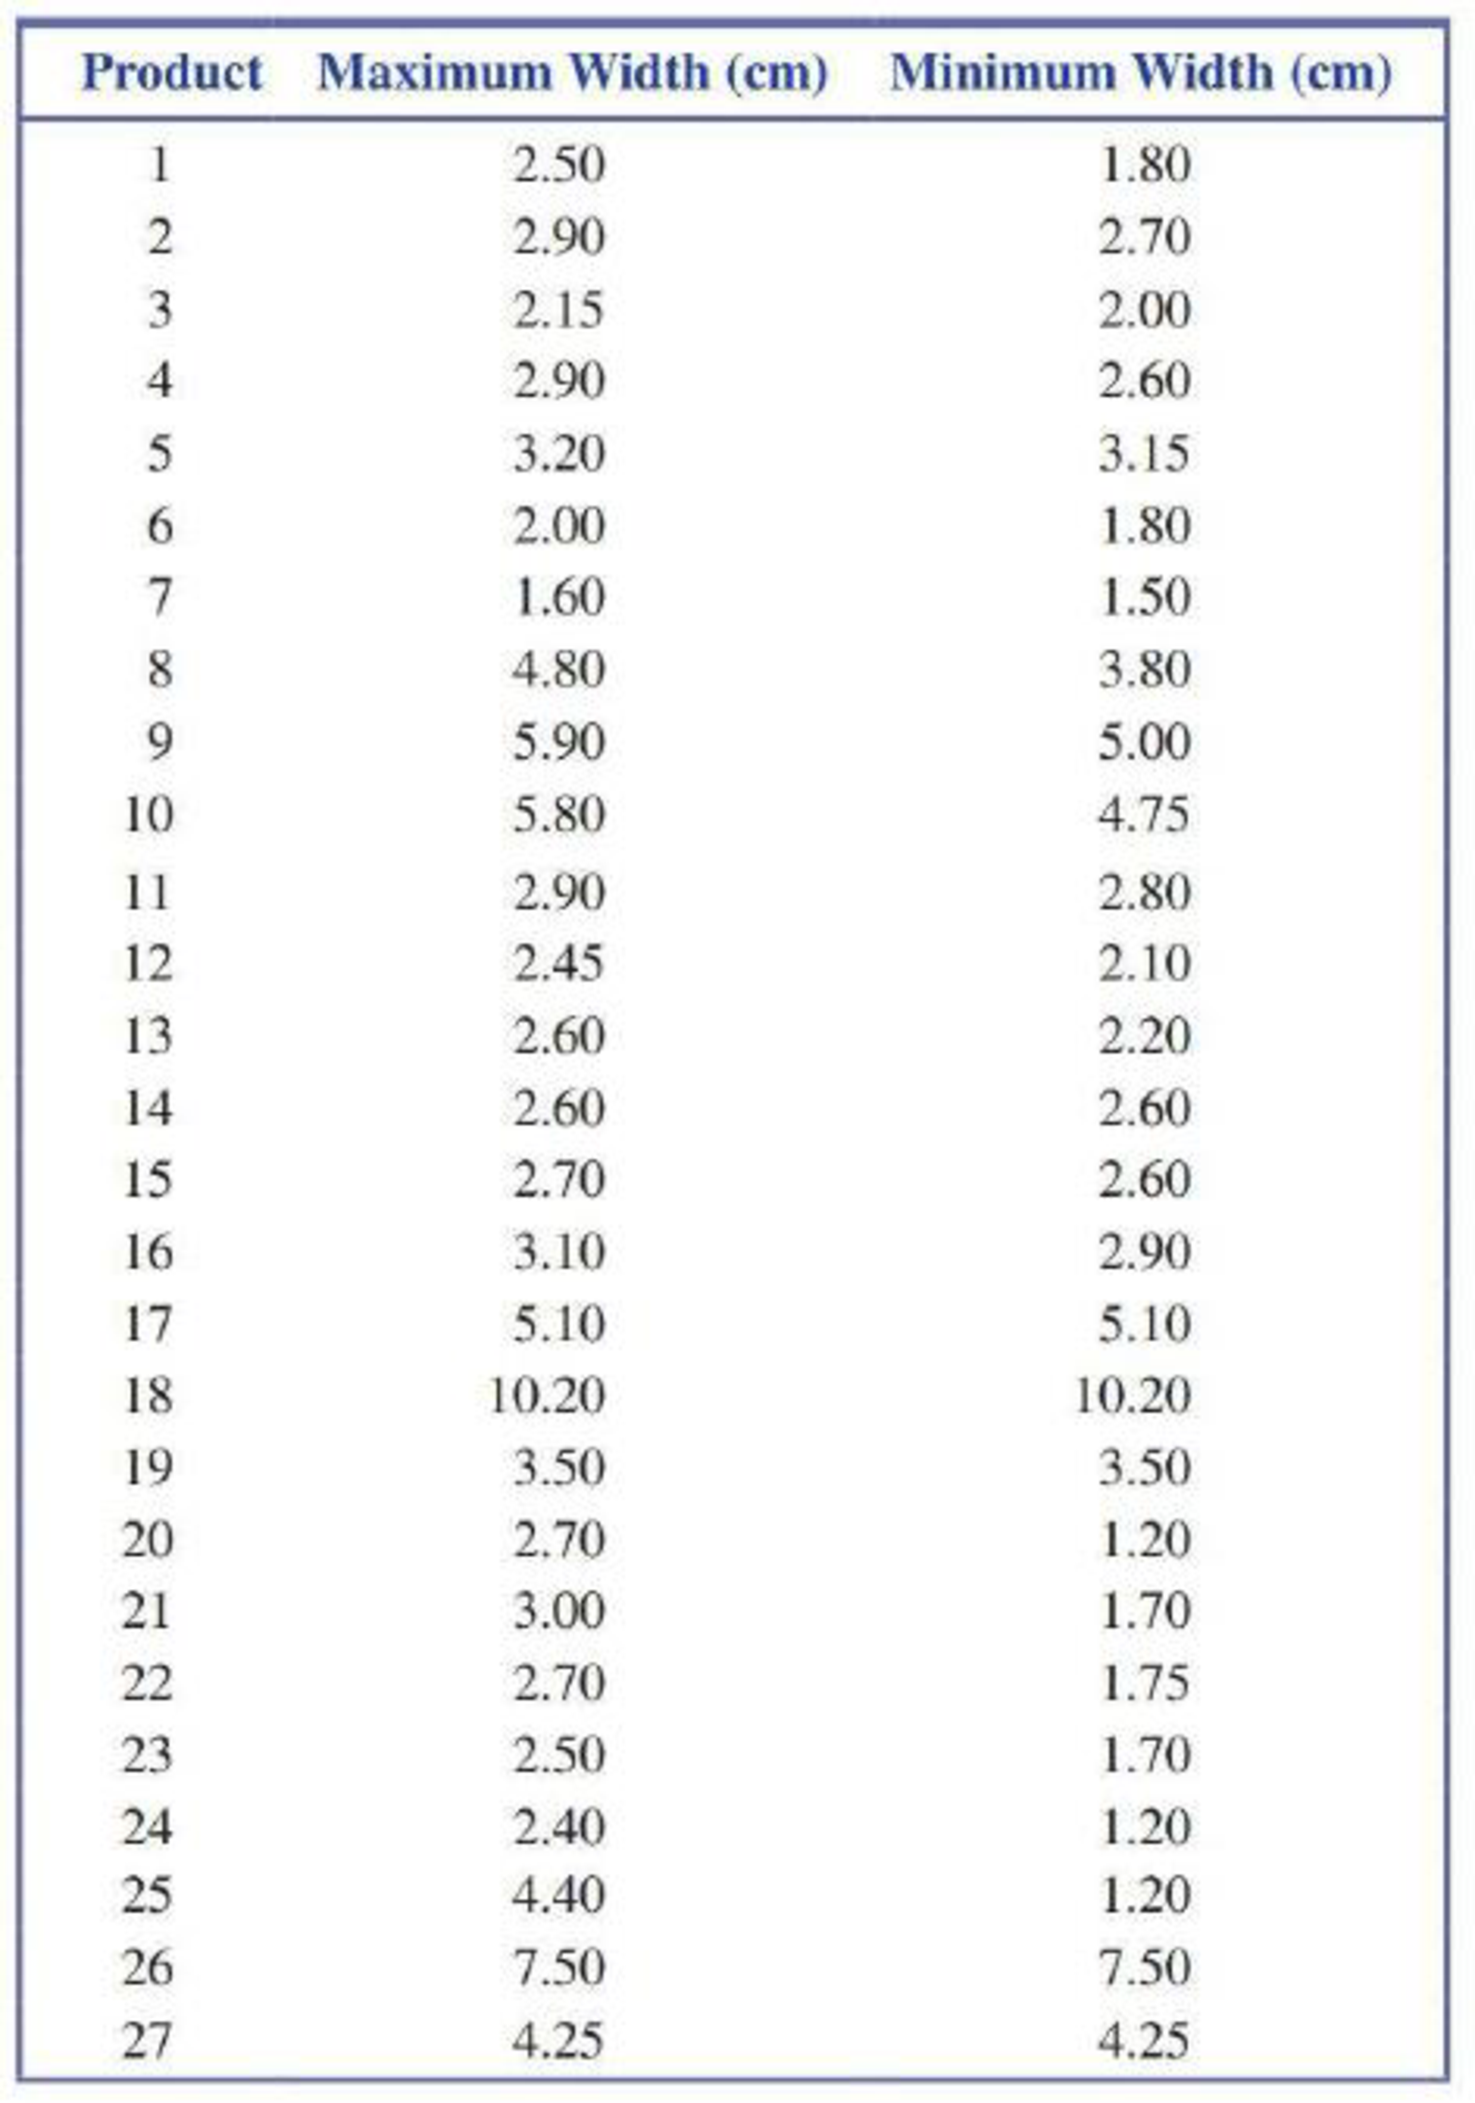
- a. Fit the simple linear regression model that would allow prediction of the maximum width of a food container based on its minimum width.
- b. Calculate the standardized residuals (or just the residuals if a computer program that doesn’t give standardized residuals is used) and make a residual plot to determine whether there are any outliers.
- c. The data point with the largest residual is for a 1-liter Coke bottle. Delete this data point and determine the equation of the regression line. Did deletion of this point result in a large change in the equation of the estimated regression line?
- d. For the regression line of Part (c), interpret the estimated slope and, if appropriate, the intercept.
- e. For the data set with the Coke bottle deleted, are the assumptions of the simple linear regression model reasonable? Give statistical evidence.
Expert Solution & Answer

Trending nowThis is a popular solution!

Students have asked these similar questions
A random variable X takes values 0 and 1 with probabilities q and p, respectively, with q+p=1. find the moment generating function of X and show that all the moments about the origin equal p. (Note- Please include as much detailed solution/steps in the solution to understand, Thank you!)
1 (Expected Shortfall)
Suppose the price of an asset Pt follows a normal random walk, i.e., Pt =
Po+r₁ + ... + rt with r₁, r2,... being IID N(μ, o²).
Po+r1+.
⚫ Suppose the VaR of rt is VaRq(rt) at level q, find the VaR of the price
in T days, i.e., VaRq(Pt – Pt–T).
-
• If ESq(rt) = A, find ES₁(Pt – Pt–T).
2 (Normal Distribution)
Let rt be a log return. Suppose that r₁, 2, ... are IID N(0.06, 0.47).
What is the distribution of rt (4) = rt + rt-1 + rt-2 + rt-3?
What is P(rt (4) < 2)?
What is the covariance between r2(2) = 1 + 12 and 13(2) = r² + 13?
• What is the conditional distribution of r₁(3) = rt + rt-1 + rt-2 given
rt-2 = 0.6?
Chapter 13 Solutions
Introduction to Statistics and Data Analysis
Ch. 13.1 - Prob. 1ECh. 13.1 - The flow rate in a device used for air quality...Ch. 13.1 - The paper Predicting Yolk Height, Yolk Width,...Ch. 13.1 - Prob. 4ECh. 13.1 - Suppose that a simple linear regression model is...Ch. 13.1 - a. Explain the difference between the line y x...Ch. 13.1 - Prob. 7ECh. 13.1 - Hormone replacement therapy (HRT) is thought to...Ch. 13.1 - Prob. 9ECh. 13.1 - A simple linear regression model was used to...
Ch. 13.1 - Consider the accompanying data on x = Advertising...Ch. 13.2 - What is the difference between and b? What is the...Ch. 13.2 - The largest commercial fishing enterprise in the...Ch. 13.2 - Prob. 14ECh. 13.2 - Prob. 15ECh. 13.2 - Prob. 16ECh. 13.2 - An experiment to study the relationship between x...Ch. 13.2 - The paper The Effects of Split Keyboard Geometry...Ch. 13.2 - The authors of the paper Decreased Brain Volume in...Ch. 13.2 - Do taller adults make more money? The authors of...Ch. 13.2 - Researchers studying pleasant touch sensations...Ch. 13.2 - Prob. 22ECh. 13.2 - Prob. 23ECh. 13.2 - Consider the accompanying data on x = Research and...Ch. 13.2 - Prob. 25ECh. 13.2 - In anthropological studies, an important...Ch. 13.3 - The graphs accompanying this exercise are based on...Ch. 13.3 - Prob. 28ECh. 13.3 - Prob. 29ECh. 13.3 - The article Vital Dimensions in Volume Perception:...Ch. 13.3 - Prob. 31ECh. 13.3 - An investigation of the relationship between x =...Ch. 13.4 - Prob. 33ECh. 13.4 - Prob. 34ECh. 13.4 - Prob. 35ECh. 13.4 - Prob. 36ECh. 13.4 - A subset of data read from a graph that appeared...Ch. 13.4 - Prob. 38ECh. 13.4 - Prob. 39ECh. 13.4 - Prob. 40ECh. 13.4 - The shelf life of packaged food depends on many...Ch. 13.4 - For the cereal data of the previous exercise, the...Ch. 13.4 - The article Performance Test Conducted for a Gas...Ch. 13.5 - Prob. 44ECh. 13.5 - Prob. 45ECh. 13.5 - A sample of n = 353 college faculty members was...Ch. 13.5 - Prob. 47ECh. 13.5 - Prob. 48ECh. 13.5 - The accompanying summary quantities for x =...Ch. 13.5 - Prob. 50ECh. 13.5 - Prob. 51ECh. 13.6 - Prob. 52ECh. 13 - Prob. 53CRCh. 13 - Prob. 54CRCh. 13 - Prob. 55CRCh. 13 - The article Photocharge Effects in Dye Sensitized...Ch. 13 - Prob. 57CRCh. 13 - Prob. 58CRCh. 13 - Prob. 59CRCh. 13 - Prob. 60CRCh. 13 - Prob. 61CRCh. 13 - The article Improving Fermentation Productivity...Ch. 13 - Prob. 63CRCh. 13 - Prob. 64CRCh. 13 - Prob. 65CRCh. 13 - Prob. 1CRECh. 13 - Prob. 2CRECh. 13 - Prob. 3CRECh. 13 - Prob. 4CRECh. 13 - Prob. 5CRECh. 13 - The accompanying graphical display is similar to...Ch. 13 - Prob. 7CRECh. 13 - Prob. 8CRECh. 13 - Consider the following data on y = Number of songs...Ch. 13 - Many people take ginkgo supplements advertised to...Ch. 13 - Prob. 11CRECh. 13 - Prob. 12CRECh. 13 - Prob. 13CRECh. 13 - Prob. 14CRECh. 13 - The discharge of industrial wastewater into rivers...Ch. 13 - Many people take ginkgo supplements advertised to...Ch. 13 - It is hypothesized that when homing pigeons are...Ch. 13 - Prob. 18CRE
Knowledge Booster


Learn more about
Need a deep-dive on the concept behind this application? Look no further. Learn more about this topic, statistics and related others by exploring similar questions and additional content below.Similar questions
- 3 (Sharpe-ratio) Suppose that X1, X2,..., is a lognormal geometric random walk with parameters (μ, o²). Specifically, suppose that X = Xo exp(rı + ...Tk), where Xo is a fixed constant and r1, T2, ... are IID N(μ, o²). Find the Sharpe-ratios of rk and log(Xk) — log(Xo) respectively, assuming the risk free return is 0.arrow_forwardi need help with question 2arrow_forward4 (Value-at-Risk and Expected Shortfall) Suppose X Find VaR0.02(X) and ES0.02 (X). ~ Uniform(-1, 1).arrow_forward
- 亚 ח Variables Name avgdr employ educ exerany Label AVG ALCOHOLIC DRINKS PER DAY IN PAST 30 EMPLOYMENT STATUS EDUCATION LEVEL EXERCISE IN PAST 30 DAYSarrow_forwardVariables Name wage hours IQ KWW educ exper tenure age married black south urban sibs brthord meduc feduc Label monthly earnings average weekly hours IQ score knowledge of world work score years of education years of work experience years with current employer age in years =1 if married =1 if black =1 if live in south =1 if live in SMSA number of siblings birth order mother's education father's educationarrow_forwardInformation for questions 4 • • Please Download "wages" from Canvas (the link to this dataset is right below the HWA1 questions - it is a Microsoft excel worksheet) and store it in your favorite folder. It contains 797 observations and 16 variables. The "state" variable gives the names of the states involved in this dataset. • You need to have excel on your computer to open this dataset. i. You should use File > Import > Excel Spreadsheet etc. as done in class 3 convert this file into a Stata dataset. Once you are done, write the final STATA code that makes the transformation of an excel file to a STATA file possible. ii. Write a code that will close the log file that has been open since Question 1 part ii.arrow_forward
- The mean, variance, skewness and kurtosis of a dataset are given as - Mean = 15, Variance = 20, SKewness = 1.5 and Kurtosis = 3.5 calculate the first four raw moments. (Note- Please include as much detailed solution/steps in the solution to understand, Thank you!)arrow_forwardWrite codes to perform the functions in each of these cases i. ii. Apply cd command to tell STATA the filepath associated with your "favorite folder" (use the same name for the favorite folder that we have been using in class) Apply log using command to tell stata that you are creating a log file to record the codes and the outcomes of these codes. Make sure your log file is called loghwa1_W25.smcl. Do not forget to include the replace option. iii. Get help for the "regress" command & include a screenshot of the outcome of this code iv. V. Open a stata file stored in STATA memory called pop2000.dta Continue from question iv. Save this file in your favorite folder (current working directory) using a different name & a replace optionarrow_forwardAre there any unusually high or low pH levels in this sample of wells?arrow_forward
- 0 n AM RIES s of of 10 m Frequency 40 Frequency 20 20 30 10 You make two histograms from two different data sets (see the following figures), each one containing 200 observations. Which of the histograms has a smaller spread: the first or the second? 40 30 20 10 0 20 40 60 0 20 20 40 60 60 80 80 100 80 100arrow_forwardTIP the aren't, the data are not sym 11 Suppose that the average salary at a certain company is $100,000, and the median salary is $40,000. a. What do these figures tell you about the shape of the histogram of salaries at this company? b. Which measure of center is more appro- priate here? c. Suppose that the company goes through a salary negotiation. How can people on each side use these summary statistics to their advantage? 6360 be 52 PART 1 Getting Off to a Statistically Significant Sarrow_forward12 Suppose that you know that a data set is skewed left, and you know that the two measures of center are 19 and 38. Which figure is the mean and which is the median?arrow_forward
arrow_back_ios
SEE MORE QUESTIONS
arrow_forward_ios
Recommended textbooks for you
 Elementary Linear Algebra (MindTap Course List)AlgebraISBN:9781305658004Author:Ron LarsonPublisher:Cengage Learning
 Linear Algebra: A Modern IntroductionAlgebraISBN:9781285463247Author:David PoolePublisher:Cengage Learning
 Big Ideas Math A Bridge To Success Algebra 1: Stu...AlgebraISBN:9781680331141Author:HOUGHTON MIFFLIN HARCOURTPublisher:Houghton Mifflin Harcourt
 Functions and Change: A Modeling Approach to Coll...AlgebraISBN:9781337111348Author:Bruce Crauder, Benny Evans, Alan NoellPublisher:Cengage Learning
Elementary Linear Algebra (MindTap Course List)
Algebra
ISBN:9781305658004
Author:Ron Larson
Publisher:Cengage Learning
Linear Algebra: A Modern Introduction
Algebra
ISBN:9781285463247
Author:David Poole
Publisher:Cengage Learning
Big Ideas Math A Bridge To Success Algebra 1: Stu...
Algebra
ISBN:9781680331141
Author:HOUGHTON MIFFLIN HARCOURT
Publisher:Houghton Mifflin Harcourt
Functions and Change: A Modeling Approach to Coll...
Algebra
ISBN:9781337111348
Author:Bruce Crauder, Benny Evans, Alan Noell
Publisher:Cengage Learning
Correlation Vs Regression: Difference Between them with definition & Comparison Chart; Author: Key Differences;https://www.youtube.com/watch?v=Ou2QGSJVd0U;License: Standard YouTube License, CC-BY
Correlation and Regression: Concepts with Illustrative examples; Author: LEARN & APPLY : Lean and Six Sigma;https://www.youtube.com/watch?v=xTpHD5WLuoA;License: Standard YouTube License, CC-BY