
Concept explainers
Videos
The article “Photocharge Effects in Dye Sensitized Ag[Br, I] Emulsions at Millisecond
![Chapter 13, Problem 56CR, The article Photocharge Effects in Dye Sensitized Ag[Br, I] Emulsions at Millisecond Range Exposures](https://content.bartleby.com/tbms-images/9781337793612/Chapter-13/images/93612-13-60cr-question-digital_image_001.png)
- a. Construct a
scatterplot of the data. What does it suggest? - b. Assuming that the simple linear regression model is appropriate, obtain the equation of the estimated regression line.
- c. How much of the observed variation in peak photovoltage can be explained by the model relationship?
- d. Predict peak photovoltage when percent absorption is 19.1, and compute the value of the corresponding residual.
- e. The authors claimed that there is a useful linear relationship between the two variables. Do you agree? Carry out a formal test.
- f. Give an estimate of the average change in peak photovoltage associated with a 1 percentage point increase in light absorption. Your estimate should convey information about the precision of estimation.
- g. Give an estimate of mean peak photovoltage when percentage of light absorption is 20, and do so in a way that conveys information about precision.
a.
Construct a scatterplot for the data and explain what it suggests.
Explanation of Solution
Calculation:
The given data are on percentage of light absorption (x) and peak photo voltage (y).
If the scatterplot of the data shows a linear pattern, and the vertical variability of points does not appear to be changing over the range of x values in the sample, then it can be said that the data is consistent with the use of the simple linear regression model.
Software procedure:
Step-by-step procedure to obtain the scatterplot using MINITAB software:
- Choose Graph > Scatter plot.
- Select Simple.
- Click OK.
- Under Y variables, enter the column of y.
- Under X variables, enter the column of x.
- Click OK.
The output using MINITAB software is given below:
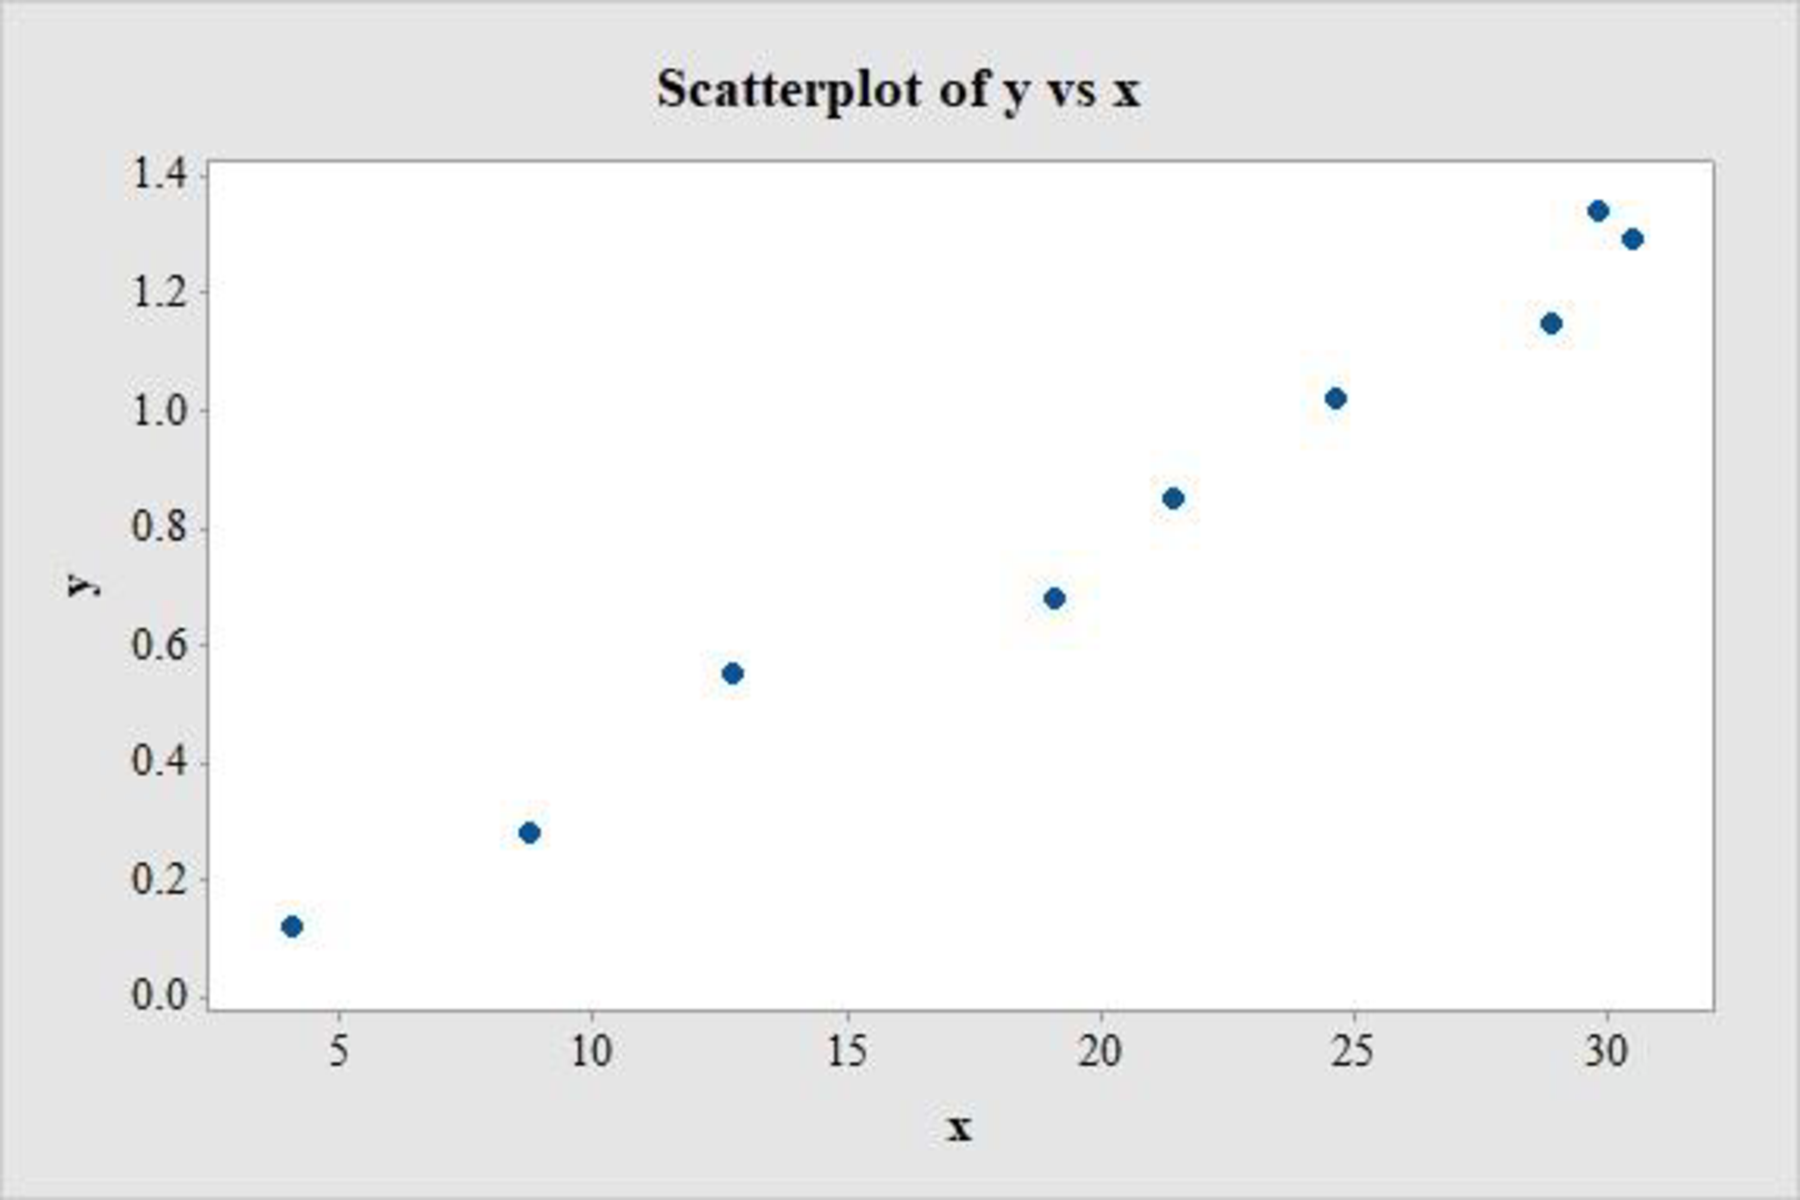
The scatter plot shows no apparent curve and there are no extreme observations. There is no change in the y values as the values of x change and there are no influential points. Therefore, the simple linear regression model seems appropriate for the data set.
b.
Find the equation of the estimated regression line by assuming that the simple linear regression model is appropriate.
Answer to Problem 56CR
The equation of the estimated regression line is,
Explanation of Solution
Calculation:
Regression Analysis:
Software procedure:
Step-by-step procedure to obtain the regression line using MINITAB software:
- Choose Stat > Regression > Regression > Fit Regression Model.
- Under Responses, enter the column of values y.
- Under Continuous predictors, enter the column of values x.
- Click OK.
Output using MINITAB software is given below:
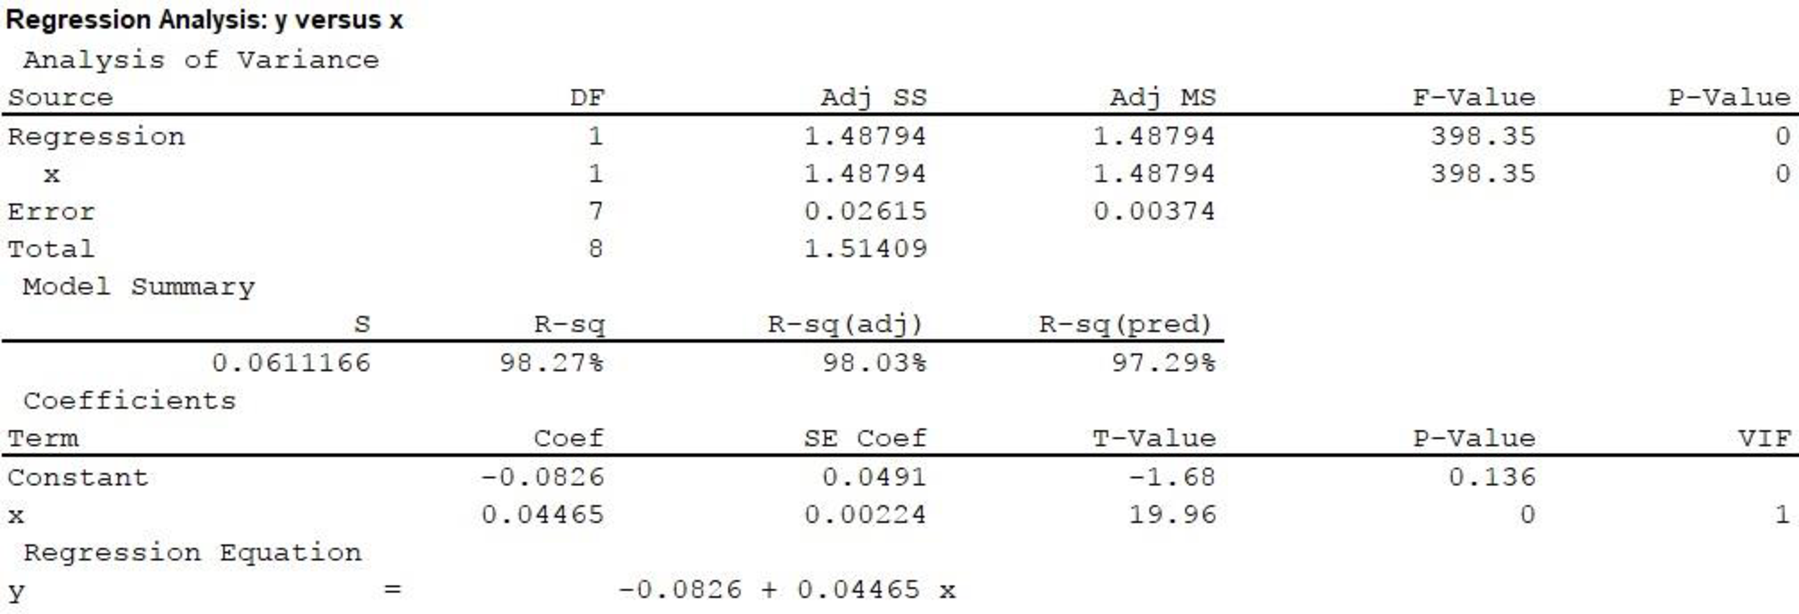
Hence, the equation of the estimated regression line by assuming that the simple linear regression model is appropriate is,
c.
Find how much of the observed variation in peak photo voltage can be explained by the model relationship.
Answer to Problem 56CR
The percentage of observed variation in peak photo voltage that can be explained by the model relationship is 98.3%.
Explanation of Solution
From the Minitab output in Part (b), the value of
This implies that 98.27%, or approximately 98.3% of the observed variation in the dependent variable ‘peak photo voltage’ is being explained by the independent variable ‘percentage of light absorption’ using the simple linear regression model. The change is attributable to the linear relationship between the variables ‘peak photo voltage’ and ‘percentage of light absorption’ and is being explained by the model.
Thus, the percentage of observed variation in peak photo voltage that can be explained by the model relationship is 98.3%.
d.
Predict peak photo voltage when percent absorption is 19.1.
Find the value of the corresponding residual.
Answer to Problem 56CR
The peak voltage when percent absorption is 19.1 is predicted to be 0.770.
The corresponding residual is –0.090.
Explanation of Solution
Calculation:
Predicted value:
The estimated regression equation is,
Hence, the peak voltage when percent absorption is 19.1 is predicted to be 0.770.
Residual:
The formula for residual for response, y and predicted response,
It is given that, when the percentage of light absorption is 19.1, the peak photo voltage is 0.68. Substitute
Hence, the corresponding residual is –0.09.
e.
Explain whether one can agree with the statement that there is a useful linear relationship between the two variables, by carrying out a formal test.
Explanation of Solution
Calculation:
1.
Here,
2.
Null hypothesis:
That is, there is no useful linear relationship between the percentage of light absorption and peak photo voltage.
3.
Alternative hypothesis:
That is, there is a useful linear relationship between the percentage of light absorption and peak photo voltage.
4.
Here, the significance level is assumed to be
5.
Test Statistic:
The formula for test statistic is as follows:
In the formula, b denotes the estimated slope,
6.
Assumption:
The assumption made in Part (b) is that, the simple linear regression model is appropriate.
7.
Calculation:
From the MINITAB output in Part (b), the t-test statistic value for
8.
P-value:
From the MINITAB output in Part (b), the P-value is 0.
9.
Decision rule:
- If P-value is less than or equal to the level of significance, reject the null hypothesis.
- Otherwise, fail to reject the null hypothesis.
10.
Conclusion:
The P-value is 0.
The level of significance is 0.05.
The P-value is less than the level of significance.
That is,
Based on rejection rule, reject the null hypothesis.
Thus, there is convincing evidence of a useful relationship between the percentage of light absorption and peak photo voltage at the 0.05 level of significance.
f.
Obtain an estimate of the average change in peak photo voltage associated with a 1 percentage point increase in light absorption.
Answer to Problem 56CR
The estimate of the average change in peak photo voltage associated with a 1 percentage point increase in light absorption is between 0.039 and 0.050.
Explanation of Solution
Calculation:
From the MINITAB output in Part (b), the value of slope is approximately
Formula for Degrees of freedom:
The formula for degrees of freedom is,
In the formula, n is the total number of observations.
Formula for Confidence interval for
In the formula b denotes the estimated slope and
Degrees of freedom:
The number of data values given are 9, that is
From the Appendix: Table 3 t Critical Values:
- Locate the value 7 in the degrees of freedom (df) column.
- Locate the 0.95 in the row of central area captured.
- The intersecting value that corresponds to the df 7 with confidence level 0.95 is 2.37.
Thus, the critical value for
Confidence interval:
Substitute,
Hence, the 95% confidence interval for estimating the average change in peak photo voltage associated with a 1 percentage point increase in light absorption is
Interpretation:
The 95% confidence interval can be interpreted as: there is 95% confidence that the mean increase in peak photo voltage associated with a 1 percentage point increase in light absorption lies between 0.039 and 0.050.
g.
Obtain an estimate of the average change in peak photo voltage when the percentage of light absorption is 20.
Answer to Problem 56CR
The estimate of the average change in peak photo voltage when the percentage of light absorption is 20 is between 0.762 and 0.859.
Explanation of Solution
Calculation:
The confidence interval for
From the MINITAB output in part (a), the simple linear regression model is
Point estimate:
The point estimate when the percentage of light absorption is 20 is calculated as follows.
Estimated standard deviation:
For the given x values,
Substitute,
Therefore, one can be 95% confident that the mean peak voltage when the percentage of light absorption is 20 is between 0.762 and 0.859.
Want to see more full solutions like this?
Chapter 13 Solutions
Introduction to Statistics and Data Analysis


- 2PM Tue Mar 4 7 Dashboard Calendar To Do Notifications Inbox File Details a 25/SP-CIT-105-02 Statics for Technicians Q-7 Determine the resultant of the load system shown. Locate where the resultant intersects grade with respect to point A at the base of the structure. 40 N/m 2 m 1.5 m 50 N 100 N/m Fig.- Problem-7 4 m Gradearrow_forwardNsjsjsjarrow_forwardA smallish urn contains 16 small plastic bunnies - 9 of which are pink and 7 of which are white. 10 bunnies are drawn from the urn at random with replacement, and X is the number of pink bunnies that are drawn. (a) P(X=6)[Select] (b) P(X>7) ≈ [Select]arrow_forward
- A smallish urn contains 25 small plastic bunnies - 7 of which are pink and 18 of which are white. 10 bunnies are drawn from the urn at random with replacement, and X is the number of pink bunnies that are drawn. (a) P(X = 5)=[Select] (b) P(X<6) [Select]arrow_forwardElementary StatisticsBase on the same given data uploaded in module 4, will you conclude that the number of bathroom of houses is a significant factor for house sellprice? I your answer is affirmative, you need to explain how the number of bathroom influences the house price, using a post hoc procedure. (Please treat number of bathrooms as a categorical variable in this analysis)Base on the same given data, conduct an analysis for the variable sellprice to see if sale price is influenced by living area. Summarize your finding including all regular steps (learned in this module) for your method. Also, will you conclude that larger house corresponding to higher price (justify)?Each question need to include a spss or sas output. Instructions: You have to use SAS or SPSS to perform appropriate procedure: ANOVA or Regression based on the project data (provided in the module 4) and research question in the project file. Attach the computer output of all key steps (number) quoted in…arrow_forwardElementary StatsBase on the given data uploaded in module 4, change the variable sale price into two categories: abovethe mean price or not; and change the living area into two categories: above the median living area ornot ( your two group should have close number of houses in each group). Using the resulting variables,will you conclude that larger house corresponding to higher price?Note: Need computer output, Ho and Ha, P and decision. If p is small, you need to explain what type ofdependency (association) we have using an appropriate pair of percentages. Please include how to use the data in SPSS and interpretation of data.arrow_forward
- An environmental research team is studying the daily rainfall (in millimeters) in a region over 100 days. The data is grouped into the following histogram bins: Rainfall Range (mm) Frequency 0-9.9 15 10 19.9 25 20-29.9 30 30-39.9 20 ||40-49.9 10 a) If a random day is selected, what is the probability that the rainfall was at least 20 mm but less than 40 mm? b) Estimate the mean daily rainfall, assuming the rainfall in each bin is uniformly distributed and the midpoint of each bin represents the average rainfall for that range. c) Construct the cumulative frequency distribution and determine the rainfall level below which 75% of the days fall. d) Calculate the estimated variance and standard deviation of the daily rainfall based on the histogram data.arrow_forwardAn electronics company manufactures batches of n circuit boards. Before a batch is approved for shipment, m boards are randomly selected from the batch and tested. The batch is rejected if more than d boards in the sample are found to be faulty. a) A batch actually contains six faulty circuit boards. Find the probability that the batch is rejected when n = 20, m = 5, and d = 1. b) A batch actually contains nine faulty circuit boards. Find the probability that the batch is rejected when n = 30, m = 10, and d = 1.arrow_forwardTwenty-eight applicants interested in working for the Food Stamp program took an examination designed to measure their aptitude for social work. A stem-and-leaf plot of the 28 scores appears below, where the first column is the count per branch, the second column is the stem value, and the remaining digits are the leaves. a) List all the values. Count 1 Stems Leaves 4 6 1 4 6 567 9 3688 026799 9 8 145667788 7 9 1234788 b) Calculate the first quartile (Q1) and the third Quartile (Q3). c) Calculate the interquartile range. d) Construct a boxplot for this data.arrow_forward
- Pam, Rob and Sam get a cake that is one-third chocolate, one-third vanilla, and one-third strawberry as shown below. They wish to fairly divide the cake using the lone chooser method. Pam likes strawberry twice as much as chocolate or vanilla. Rob only likes chocolate. Sam, the chooser, likes vanilla and strawberry twice as much as chocolate. In the first division, Pam cuts the strawberry piece off and lets Rob choose his favorite piece. Based on that, Rob chooses the chocolate and vanilla parts. Note: All cuts made to the cake shown below are vertical.Which is a second division that Rob would make of his share of the cake?arrow_forwardThree players (one divider and two choosers) are going to divide a cake fairly using the lone divider method. The divider cuts the cake into three slices (s1, s2, and s3). If the choosers' declarations are Chooser 1: {s1 , s2} and Chooser 2: {s2 , s3}. Using the lone-divider method, how many different fair divisions of this cake are possible?arrow_forwardTheorem 2.6 (The Minkowski inequality) Let p≥1. Suppose that X and Y are random variables, such that E|X|P <∞ and E|Y P <00. Then X+YpX+Yparrow_forward
 Functions and Change: A Modeling Approach to Coll...AlgebraISBN:9781337111348Author:Bruce Crauder, Benny Evans, Alan NoellPublisher:Cengage Learning
 College AlgebraAlgebraISBN:9781305115545Author:James Stewart, Lothar Redlin, Saleem WatsonPublisher:Cengage Learning
 Big Ideas Math A Bridge To Success Algebra 1: Stu...AlgebraISBN:9781680331141Author:HOUGHTON MIFFLIN HARCOURTPublisher:Houghton Mifflin Harcourt
 Algebra and Trigonometry (MindTap Course List)AlgebraISBN:9781305071742Author:James Stewart, Lothar Redlin, Saleem WatsonPublisher:Cengage Learning