
Videos
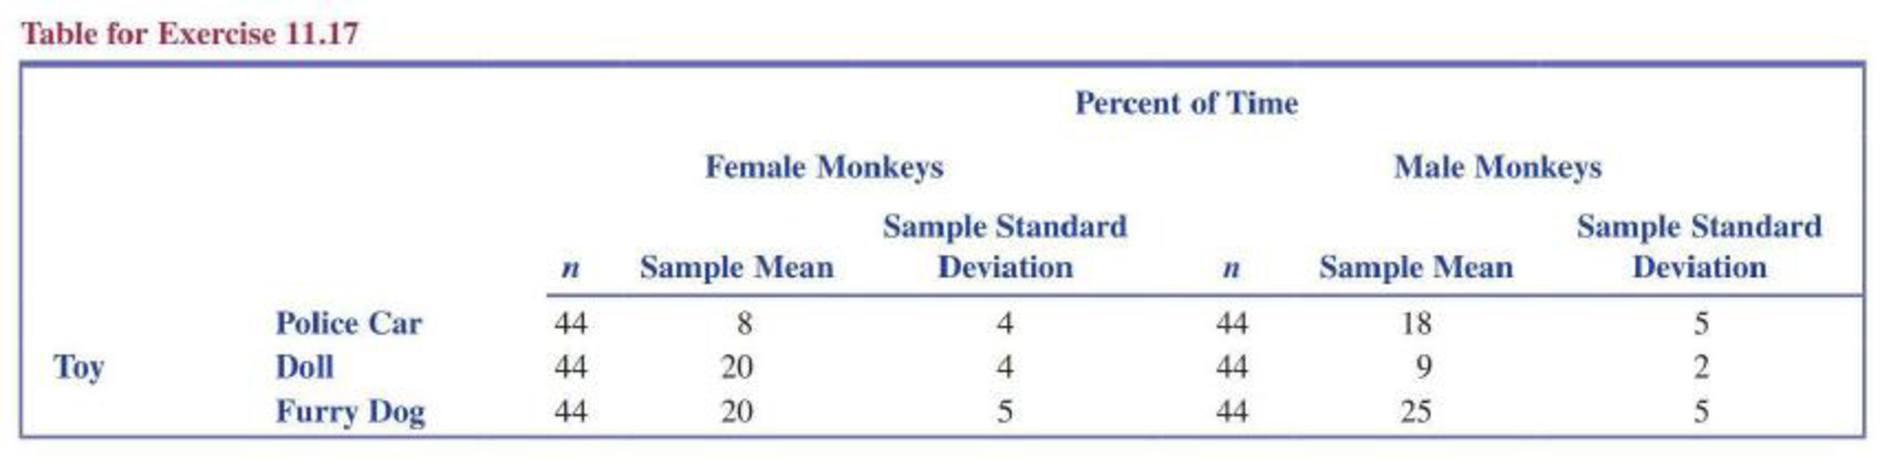
A newspaper story headline reads “Gender Plays Part in Monkeys’ Toy Choices, Research Finds—Like Humans, Male Monkeys Choose Balls and Cars, While Females Prefer Dolls and Pots” (Knight Ridder Newspapers, December 8, 2005). The article goes on to summarize findings published in the paper “Sex Differences in Response to Children’s Toys in Nonhuman Primates” (Evolution and Human Behavior [2002]: 467–479). Forty-four male monkeys and 44 female monkeys were each given a variety of toys, and the time spent playing with each toy was recorded. The table below gives means and standard deviations (approximate values read from graphs in the paper) for the percentage of time that a monkey spent playing with a particular toy. Assume that it is reasonable to regard these two samples of 44 monkeys as representative of the populations of male monkeys and female monkeys. Use a 0.05 significance level for any hypothesis tests that you carry out when answering the various parts of this exercise.
- a. The police car was considered a “masculine toy.” Do these data provide convincing evidence that the mean percentage of the time spent playing with the police car is greater for male monkeys than for female monkeys?
- b. The doll was considered a “feminine toy.” Do these data provide convincing evidence that the mean percentage of time spent playing with the doll is greater for female monkeys than for male monkeys?
- c. The furry dog was considered a “neutral toy.” Do these data provide convincing evidence that the mean percentage of time spent playing with the furry dog is not the same for male and female monkeys?
- d. Based on the conclusions from the hypothesis tests of Parts (a)–(c), is the quoted newspaper story headline a reasonable summary of the findings? Explain.
- e. Explain why it would be inappropriate to use the two-sample t test to decide if there was evidence that the mean percentage of time spent playing with the police car and the mean percentage of the time spent playing with the doll is not the same for female monkeys.
a.
Check whether mean percentage of time spent playing with police car is greater for male monkeys than for female monkeys or not.
Answer to Problem 17E
There is convincing evidence that mean percentage of time spent playing with police car is greater for male monkeys than for female monkeys.
Explanation of Solution
Calculation:
Given table provides the percentage of time spent playing with toys.
The assumptions for the two-sample t-test:
- The random samples should be collected independently.
- The sample sizes should be large. That is, each sample size is at least 30.
The assumptions in this particular problem:
- Two samples of 44 monkeys are selected randomly and independently from the population.
- The sample sizes are large enough.
Here, both sample sizes are equal to 44 and which are greater than 30.
Therefore, the assumptions are satisfied.
Let
Let
Hypotheses:
Null hypothesis:
That is, the mean percentage of time playing with police car is same for both male and female monkeys.
Alternative hypothesis:
That is, the mean percentage of time spent playing with police car is greater for male monkeys than for female monkeys.
Test statistic and P-value:
Software procedure:
Step by step procedure to obtain the P-value and test statistic by using MINITAB software is as follows:
- Choose Stat > Basic Statistics > 2 sample t.
- Choose Summarized data.
- In sample 1, enter Sample size as 44, Mean as 18, Standard deviation as 5.
- In sample 2, enter Sample size as 44, Mean as 8, Standard deviation as 4.
- Choose Options.
- In Confidence level, enter 95.
- In Alternative, select greater than.
- Click OK in all the dialogue boxes.
Output using the MINITAB software is given below:
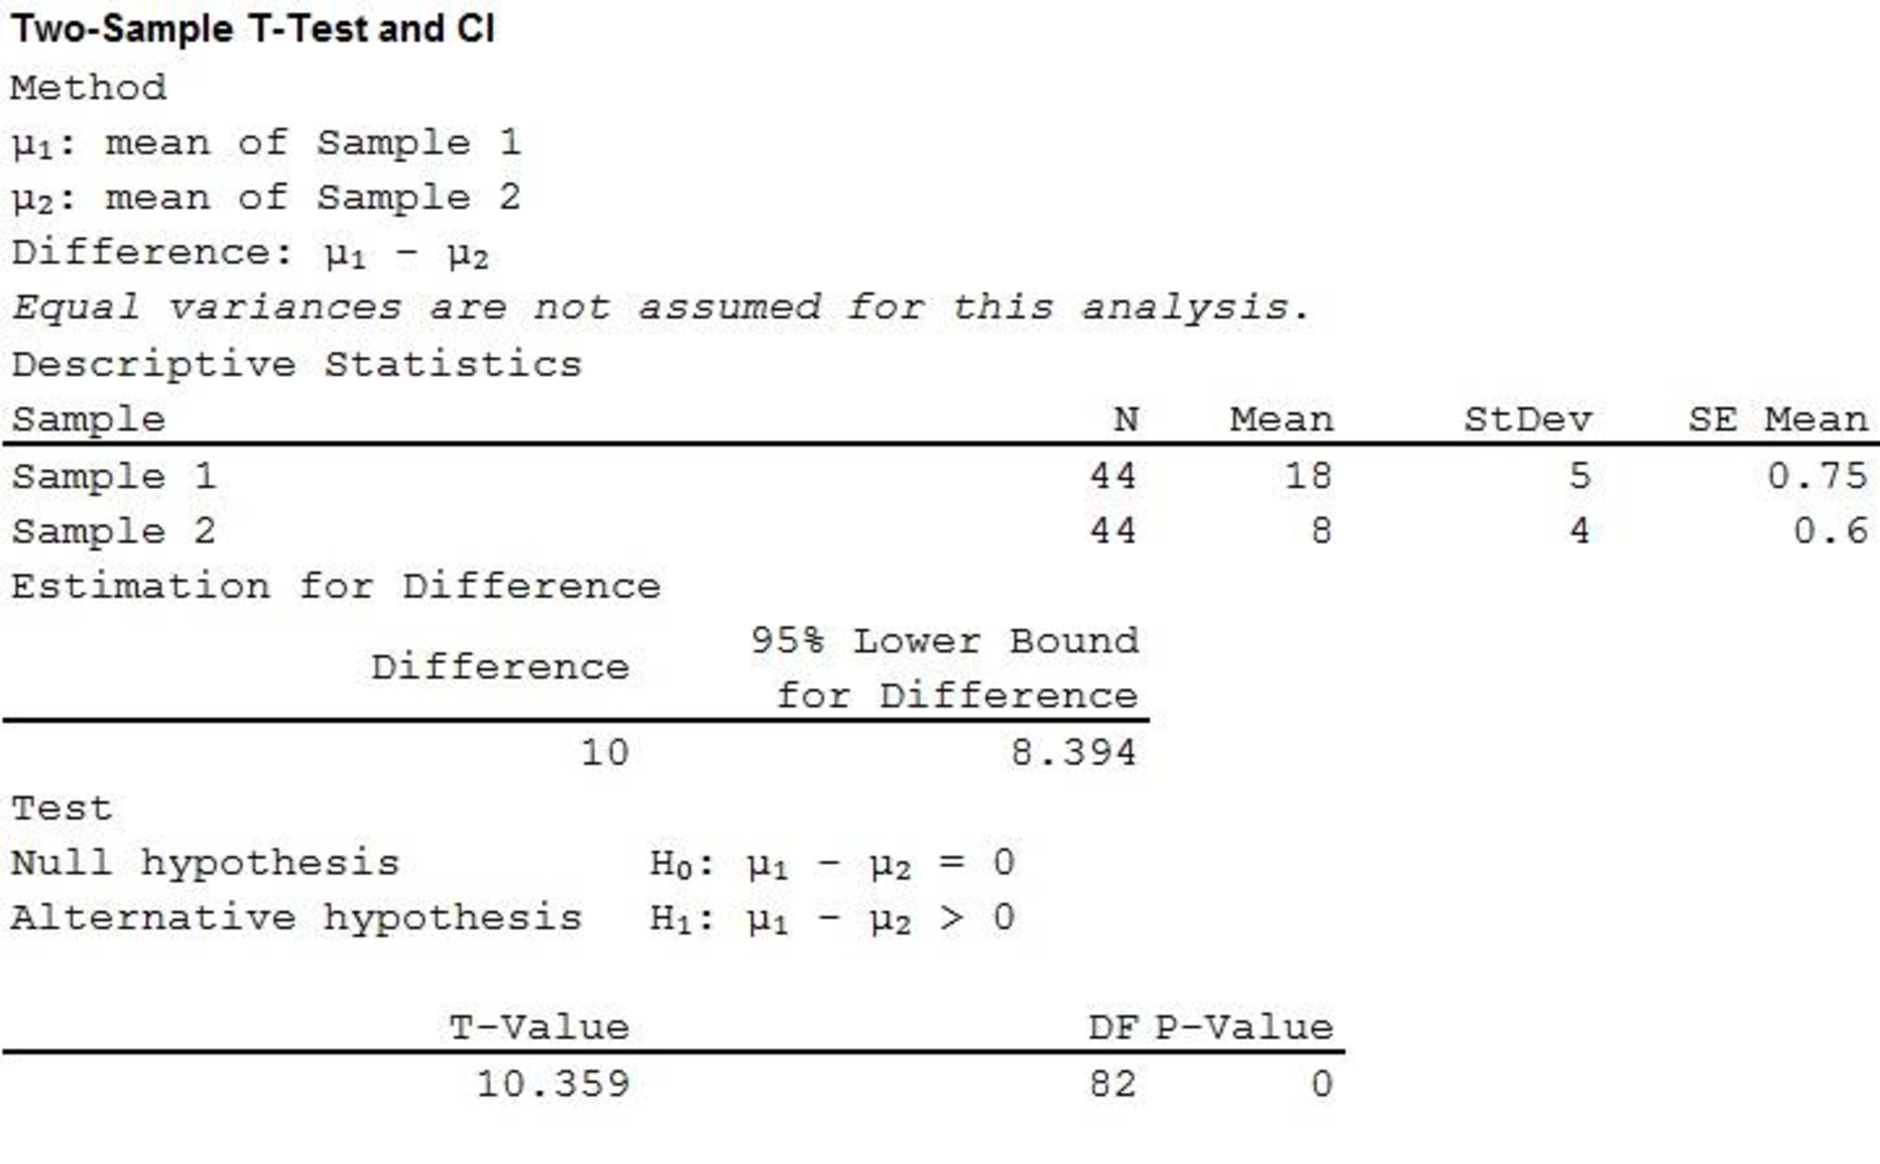
Therefore, the P-value is 0 and the test statistic is 10.359.
Decision rule:
- If P-value is less than or equal to the level of significance, reject the null hypothesis.
- Otherwise fail to reject the null hypothesis.
Conclusion:
Here, the level of significance is 0.05.
Here, P-value is less than the level of significance.
That is,
Therefore, reject the null hypothesis.
Hence, there is proper evidence to support the claim that the mean percentage of time spent playing with police car is greater for male monkeys than for female monkeys.
b.
Check whether mean percentage of time spent playing with doll is greater for female monkeys than for male monkeys or not.
Answer to Problem 17E
There is convincing evidence that mean percentage of time spent playing with doll is greater for female monkeys than for male monkeys.
Explanation of Solution
Calculation:
The assumption for the two-sample t-test:
- The random samples should be collected independently.
- The sample sizes should be large. That is, each sample size is at least 30.
The assumptions in this particular problem:
- Two samples of 44 monkeys are selected randomly and independently from the population.
- The sample sizes are large enough.
Here, both sample sizes are equal to 44 and which are greater than 30.
Therefore, the assumptions are satisfied.
Let
Let
Hypotheses:
Null hypothesis:
That is, the mean percentage of time playing with doll is same for both male and female monkeys.
Alternative hypothesis:
That is, the mean percentage of time spent playing with doll is greater for female monkeys than for male monkeys.
Test statistic and P-value:
Software procedure:
Step by step procedure to obtain the P-value and test statistic by using MINITAB software is as follows:
- Choose Stat > Basic Statistics > 2 sample t.
- Choose Summarized data.
- In sample 1, enter Sample size as 44, Mean as 9, Standard deviation as 2.
- In sample 2, enter Sample size as 44, Mean as 20, Standard deviation as 4.
- Choose Options.
- In Confidence level, enter 95.
- In Alternative, select less than.
- Click OK in all the dialogue boxes.
Output using the MINITAB software is given below:
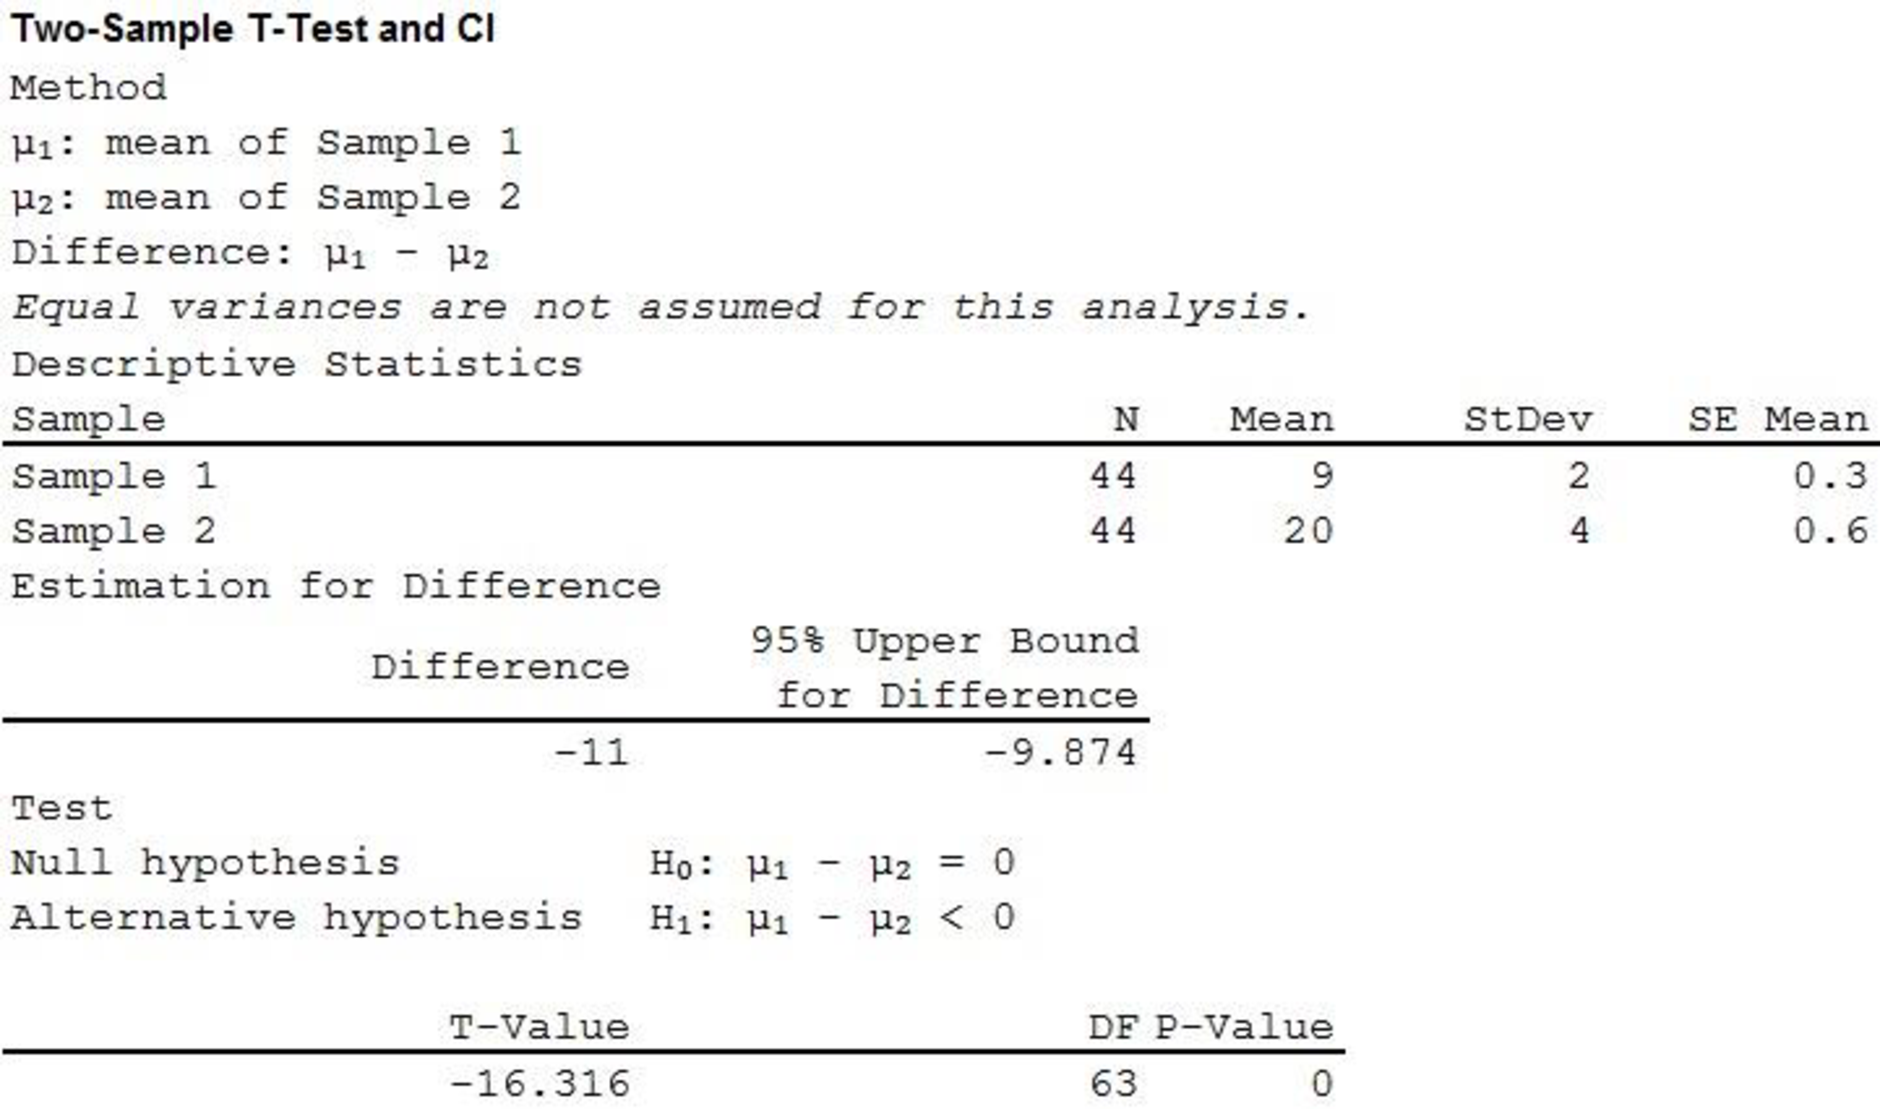
Therefore, the P-value is 0 and the test statistic is –16.316.
Decision rule:
- If P-value is less than or equal to the level of significance, reject the null hypothesis.
- Otherwise fail to reject the null hypothesis.
Conclusion:
Here, the level of significance is 0.05.
Here, P-value is less than the level of significance.
That is,
Therefore, reject the null hypothesis.
Hence, there is proper evidence to support the claim that the mean percentage of time spent playing with doll is greater for female monkeys than for male monkeys.
c.
Check whether mean percentage of time spent playing with furry dog is not the same for female and male monkeys or not.
Answer to Problem 17E
There is convincing evidence that mean percentage of time spent playing with furry dog is not the same for female and male monkeys.
Explanation of Solution
Calculation:
The assumption for the two-sample t-test:
- The random samples should be collected independently.
- The sample sizes should be large. That is, each sample size is at least 30.
The assumptions in this particular problem:
- Two samples of 44 monkeys are selected randomly and independently from the population.
- The sample sizes are large enough.
Here, both sample sizes are equal to 44 and which are greater than 30.
Therefore, the assumptions are satisfied.
Let
Let
Hypotheses:
Null hypothesis:
That is, the mean percentage of time playing with furry dog is same for both male and female monkeys.
Alternative hypothesis:
That is, the mean percentage of time spent playing with furry dog is not the same for female and male monkeys.
Test statistic and P-value:
Software procedure:
Step by step procedure to obtain the P-value and test statistic by using MINITAB software is as follows:
- Choose Stat > Basic Statistics > 2 sample t.
- Choose Summarized data.
- In sample 1, enter Sample size as 44, Mean as 25, Standard deviation as 5.
- In sample 2, enter Sample size as 44, Mean as 20, Standard deviation as 5.
- Choose Options.
- In Confidence level, enter 95.
- In Alternative, select not equal.
- Click OK in all the dialogue boxes.
Output using the MINITAB software is given below:
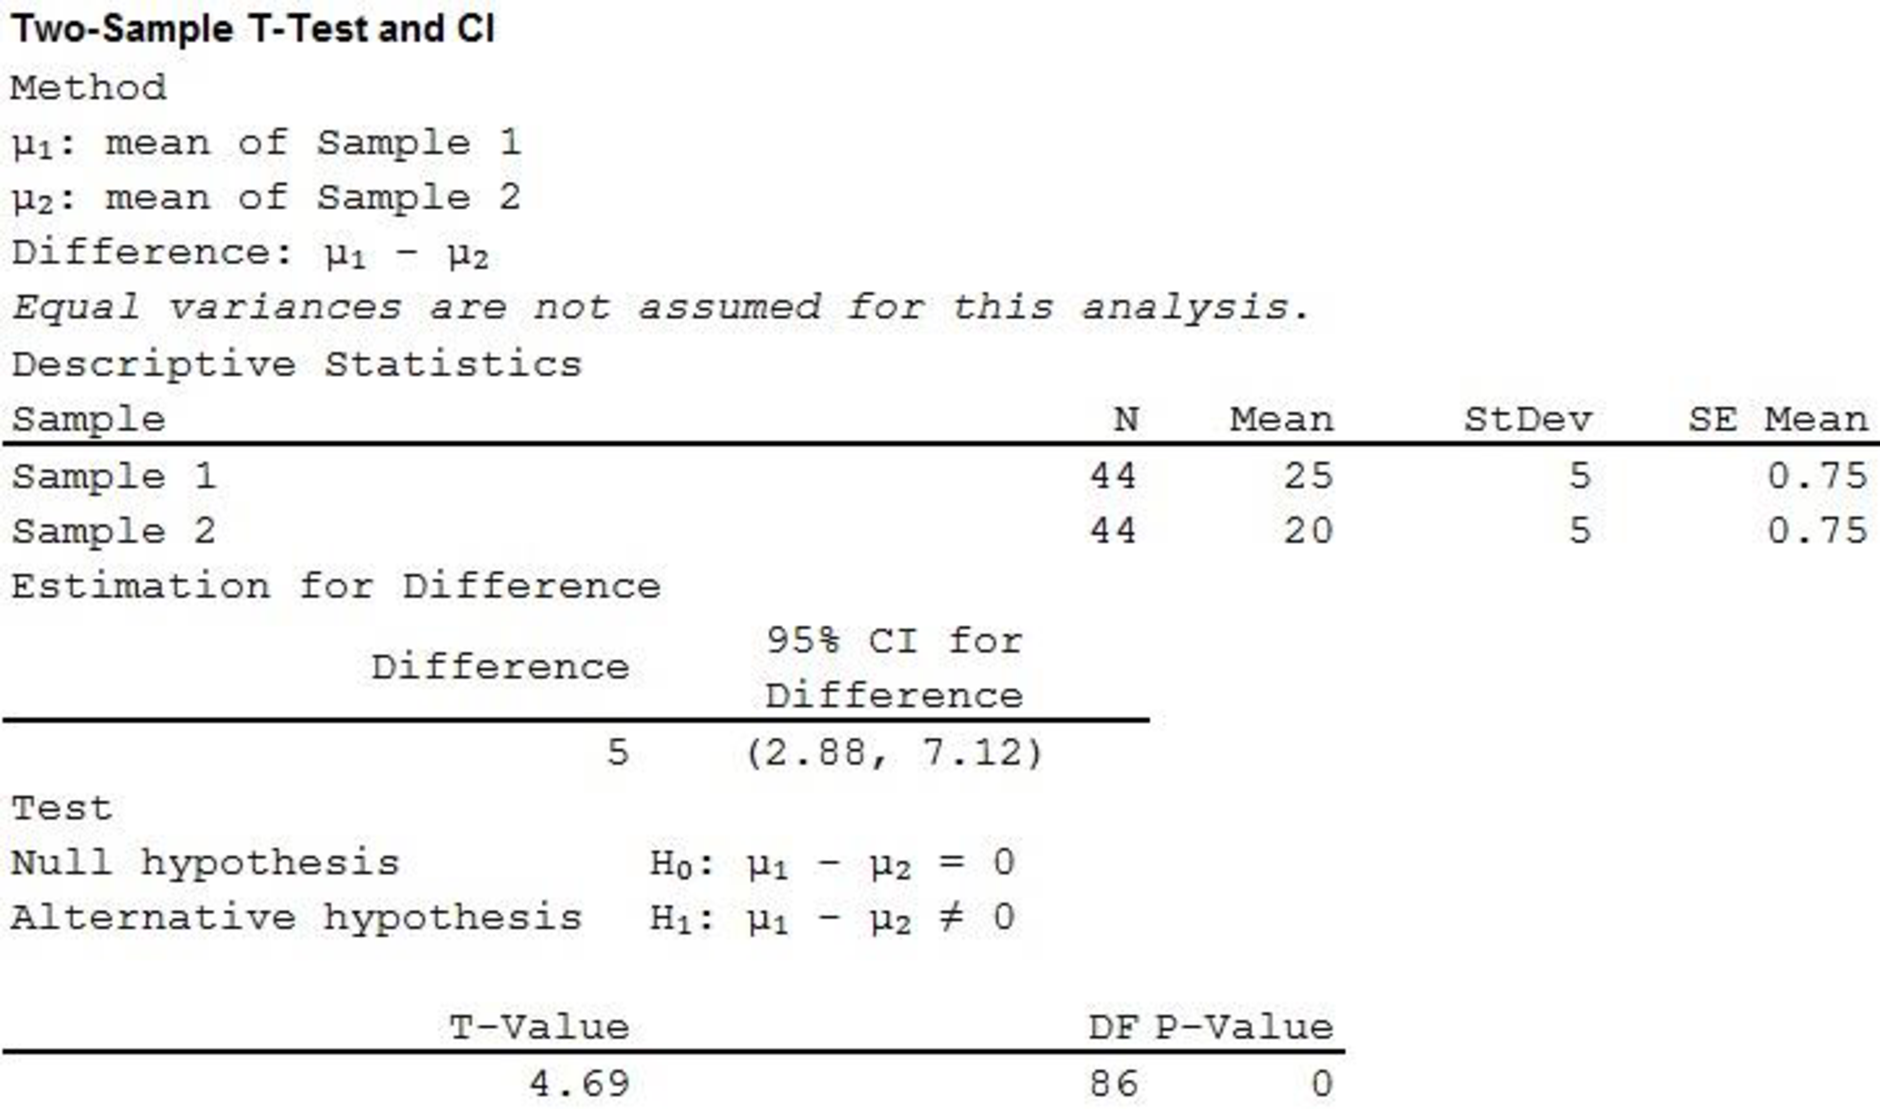
Therefore, the P-value is 0 and the test statistic is 4.690.
Decision rule:
- If P-value is less than or equal to the level of significance, reject the null hypothesis.
- Otherwise fail to reject the null hypothesis.
Conclusion:
Here, the level of significance is 0.05.
Here, P-value is less than the level of significance.
That is,
Therefore, reject the null hypothesis.
Hence, there is proper evidence to support the claim that the mean percentage of time spent playing with furry dog is not the same for female and male monkeys.
d.
Explain whether the newspaper head line a reasonable summary of the findings.
Explanation of Solution
From parts (a), (b), and (c), it is clear that, the male monkeys spent more time with masculine toy than female monkeys, the female monkeys spent more time with feminine toy than male monkeys, mean percentage of time spent playing with neutral toy is not same for female and male monkeys. Therefore the result shows convincing evidence of a gender basis in the monkeys’ choice of how much time to spend playing with three of the toys.
e.
Explain why two sample t test is inappropriate in this situation.
Explanation of Solution
Here, the population under consideration is female monkeys. The mean percentage of time spent playing with the police car and mean time spent playing with the doll is not same for the population. That is samples are taken from the same population. That is, samples are dependent. Two sample t test is appropriate only when samples are independent. Therefore, two sample t test is inappropriate in this situation.
Want to see more full solutions like this?
Chapter 11 Solutions
Introduction to Statistics and Data Analysis


- Let X be a continuous RV with PDF where a > 0 and 0 > 0 are parameters. verify that f-∞ /x (x)dx = 1. Find the CDF, Fx (7), of X.arrow_forward6. [20] Let X be a continuous RV with PDF 2(1), 1≤x≤2 fx(x) = 0, otherwisearrow_forwardA survey of 581 citizens found that 313 of them favor a new bill introduced by the city. We want to find a 95% confidence interval for the true proportion of the population who favor the bill. What is the lower limit of the interval? Enter the result as a decimal rounded to 3 decimal digits. Your Answer:arrow_forward
- A survey of 581 citizens found that 313 of them favor a new bill introduced by the city. We want to find a 95% confidence interval for the true proportion of the population who favor the bill. What is the lower limit of the interval? Enter the result as a decimal rounded to 3 decimal digits. Your Answer:arrow_forward2. The SMSA data consisting of 141 observations on 10 variables is fitted by the model below: 1 y = Bo+B1x4 + ẞ2x6 + ẞ3x8 + √1X4X8 + V2X6X8 + €. See Question 2, Tutorial 3 for the meaning of the variables in the above model. The following results are obtained: Estimate Std. Error t value Pr(>|t|) (Intercept) 1.302e+03 4.320e+02 3.015 0.00307 x4 x6 x8 x4:x8 x6:x8 -1.442e+02 2.056e+01 -7.013 1.02e-10 6.340e-01 6.099e+00 0.104 0.91737 -9.455e-02 5.802e-02 -1.630 0.10550 2.882e-02 2.589e-03 11.132 1.673e-03 7.215e-04 2.319 F) x4 1 3486722 3486722 17.9286 4.214e-05 x6 1 14595537 x8 x4:x8 x6:x8 1 132.4836 < 2.2e-16 1045693 194478 5.3769 0.02191 1 1198603043 1198603043 6163.1900 < 2.2e-16 1 25765100 25765100 1045693 Residuals 135 26254490 Estimated variance matrix (Intercept) x4 x6 x8 x4:x8 x6:x8 (Intercept) x4 x6 x8 x4:x8 x6:x8 0.18875694 1.866030e+05 -5.931735e+03 -2.322825e+03 -16.25142055 0.57188953 -5.931735e+03 4.228816e+02 3.160915e+01 0.61621781 -0.03608028 -0.00445013 -2.322825e+03…arrow_forwardIn some applications the distribution of a discrete RV, X resembles the Poisson distribution except that 0 is not a possible value of X. Consider such a RV with PMF where 1 > 0 is a parameter, and c is a constant. (a) Find the expression of c in terms of 1. (b) Find E(X). (Hint: You can use the fact that, if Y ~ Poisson(1), the E(Y) = 1.)arrow_forward
- Suppose that X ~Bin(n,p). Show that E[(1 - p)] = (1-p²)".arrow_forwardI need help with this problem and an explanation of the solution for the image described below. (Statistics: Engineering Probabilities)arrow_forwardI need help with this problem and an explanation of the solution for the image described below. (Statistics: Engineering Probabilities)arrow_forward
- This exercise is based on the following data on four bodybuilding supplements. (Figures shown correspond to a single serving.) Creatine(grams) L-Glutamine(grams) BCAAs(grams) Cost($) Xtend(SciVation) 0 2.5 7 1.00 Gainz(MP Hardcore) 2 3 6 1.10 Strongevity(Bill Phillips) 2.5 1 0 1.20 Muscle Physique(EAS) 2 2 0 1.00 Your personal trainer suggests that you supplement with at least 10 grams of creatine, 39 grams of L-glutamine, and 90 grams of BCAAs each week. You are thinking of combining Xtend and Gainz to provide you with the required nutrients. How many servings of each should you combine to obtain a week's supply that meets your trainer's specifications at the least cost? (If an answer does not exist, enter DNE.) servings of xtend servings of gainzarrow_forwardI need help with this problem and an explanation of the solution for the image described below. (Statistics: Engineering Probabilities)arrow_forwardI need help with this problem and an explanation of the solution for the image described below. (Statistics: Engineering Probabilities)arrow_forward
 Holt Mcdougal Larson Pre-algebra: Student Edition...AlgebraISBN:9780547587776Author:HOLT MCDOUGALPublisher:HOLT MCDOUGAL
 College Algebra (MindTap Course List)AlgebraISBN:9781305652231Author:R. David Gustafson, Jeff HughesPublisher:Cengage Learning
 Glencoe Algebra 1, Student Edition, 9780079039897...AlgebraISBN:9780079039897Author:CarterPublisher:McGraw Hill