
Introduction to Statistics and Data Analysis
5th Edition
ISBN: 9781305115347
Author: Roxy Peck; Chris Olsen; Jay L. Devore
Publisher: Brooks Cole
expand_more
expand_more
format_list_bulleted
Videos
Textbook Question
Chapter 11, Problem 79CR
Dentists make many people nervous. To see whether such nervousness elevates blood pressure, the blood pressure and pulse rates of 60 subjects were measured in a dental setting and in a medical setting (“The Effect of the Dental Setting on Blood Pressure Measurement,” American Journal of Public Health [1983]: 1210–1214). For each subject, the difference (dental-setting blood pressure minus medical-setting blood pressure) was calculated. The analogous differences were also calculated for pulse rates. Summary data follow.
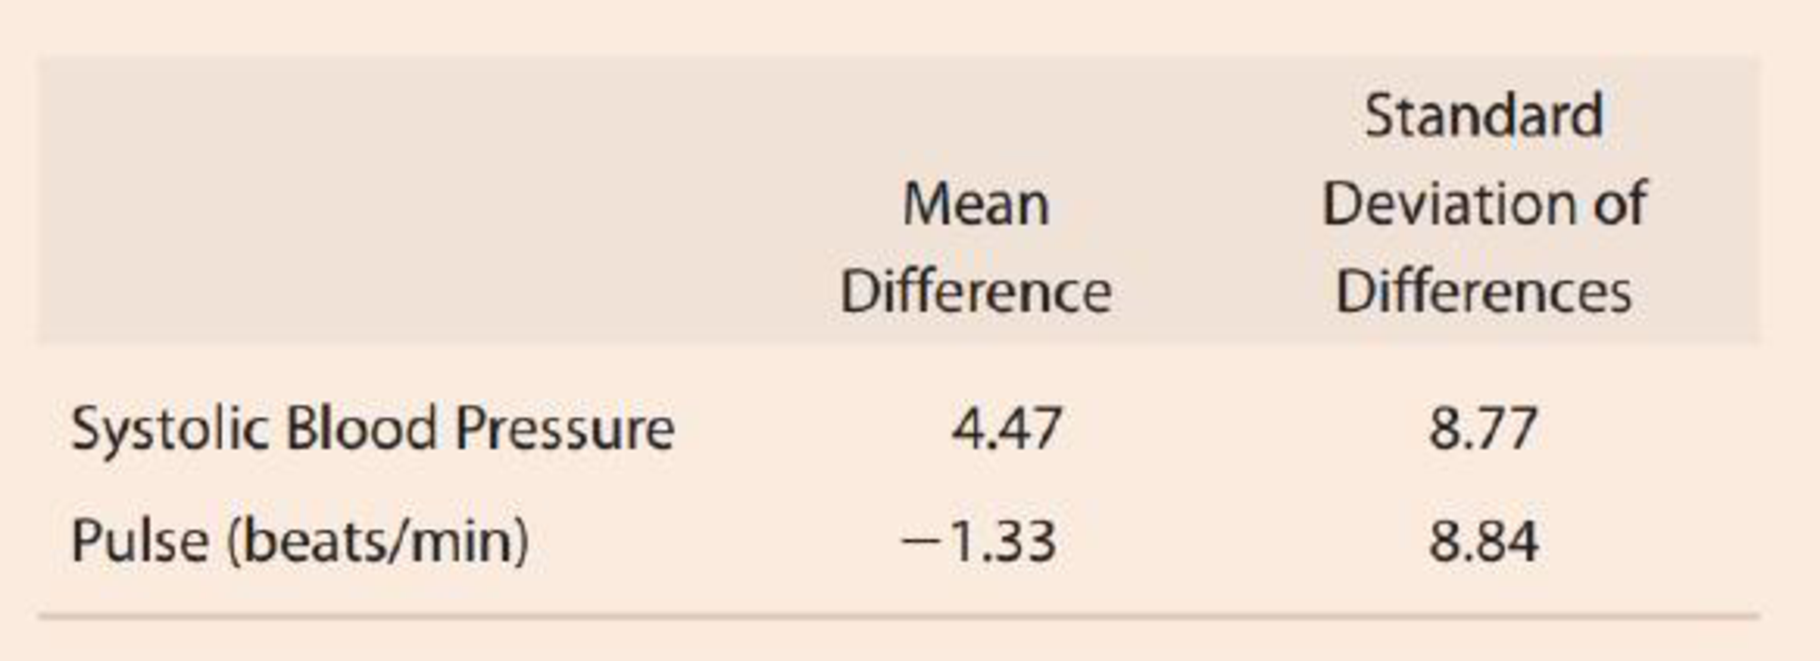
- a. Do the data strongly suggest that true
mean blood pressure is greater in a dental setting than in a medical setting? Use a level .01 test. - b. Is there sufficient evidence to indicate that true mean pulse rate in a dental setting differs from the true mean pulse rate in a medical setting? Use a significance level of .05.
Expert Solution & Answer
Want to see the full answer?
Check out a sample textbook solution
Students have asked these similar questions
a small pond contains eight catfish and six bluegill. If seven fish are caught at random, what is the probability that exactly five catfish have been caught?
23 The line graph in the following figure shows
Revenue ($ millions)
one company's revenues over time. Explain
why this graph is misleading and what you
can do to fix the problem.
700
60-
50-
40
30
Line Graph of Revenue
20-
101
1950
1970
1975 1980 1985
Year
1990
2000
d of the
20
respectively.
Interpret the shape, center and spread of the
following box plot.
14
13
12
11
10
6
T
89
7
9
5.
治
Chapter 11 Solutions
Introduction to Statistics and Data Analysis
Ch. 11.1 - Consider two populations for which 1 = 30, 1 = 2,...Ch. 11.1 - An individual can take either a scenic route to...Ch. 11.1 - Prob. 3ECh. 11.1 - Prob. 4ECh. 11.1 - The article Plugged In, but Tuned Out (USA TODAY,...Ch. 11.1 - Prob. 6ECh. 11.1 - Prob. 7ECh. 11.1 - The paper If Its Hard to Read, Its Hard to Do...Ch. 11.1 - Is injecting medical cement effective in reducing...Ch. 11.1 - Prob. 10E
Ch. 11.1 - Prob. 11ECh. 11.1 - The paper Mood Food: Chocolate and Depressive...Ch. 11.1 - Prob. 13ECh. 11.1 - Example 11.1 looked at a study comparing students...Ch. 11.1 - Prob. 15ECh. 11.1 - Prob. 16ECh. 11.1 - A newspaper story headline reads Gender Plays Part...Ch. 11.1 - Prob. 18ECh. 11.1 - Fumonisins are environmental toxins produced by a...Ch. 11.1 - A researcher at the Medical College of Virginia...Ch. 11.1 - Do certain behaviors result in a severe drain on...Ch. 11.2 - Suppose that you were interested in investigating...Ch. 11.2 - Head movement evaluations are important because...Ch. 11.2 - To determine if chocolate milk was as effective as...Ch. 11.2 - The humorous paper Will Humans Swim Faster or...Ch. 11.2 - The study described in the paper Marketing Actions...Ch. 11.2 - Prob. 27ECh. 11.2 - The paper Less Air Pollution Leads to Rapid...Ch. 11.2 - The paper The Truth About Lying in Online Dating...Ch. 11.2 - Prob. 30ECh. 11.2 - Prob. 31ECh. 11.2 - The paper Quantitative Assessment of Glenohumeral...Ch. 11.2 - Two proposed computer mouse designs were compared...Ch. 11.2 - Prob. 34ECh. 11.2 - Prob. 35ECh. 11.2 - The authors of the paper Ultrasound Techniques...Ch. 11.3 - Some people seem to believe that you can fix...Ch. 11.3 - Prob. 38ECh. 11.3 - After the 2010 earthquake in Haiti, many...Ch. 11.3 - Prob. 40ECh. 11.3 - The report Audience Insights: Communicating to...Ch. 11.3 - Prob. 42ECh. 11.3 - Prob. 43ECh. 11.3 - Prob. 44ECh. 11.3 - The article Fish Oil Staves Off Schizophrenia (USA...Ch. 11.3 - The report Young People Living on the Edge...Ch. 11.3 - Prob. 47ECh. 11.3 - Prob. 48ECh. 11.3 - Prob. 49ECh. 11.3 - Prob. 50ECh. 11.3 - Prob. 51ECh. 11.3 - The article Spray Flu Vaccine May Work Better Than...Ch. 11.3 - Prob. 53ECh. 11.3 - The following quote is from the article Canadians...Ch. 11.3 - Prob. 55ECh. 11.3 - Women diagnosed with breast cancer whose tumors...Ch. 11.3 - Prob. 57ECh. 11.4 - The paper The Psychological Consequences of Money...Ch. 11.4 - An experiment to determine if an online...Ch. 11.4 - The paper Ready or Not? Criteria for Marriage...Ch. 11 - Prob. 61CRCh. 11 - Prob. 62CRCh. 11 - A deficiency of the trace element selenium in the...Ch. 11 - Prob. 64CRCh. 11 - Prob. 65CRCh. 11 - In a study of a proposed treatment for diabetes...Ch. 11 - When a surgeon repairs injuries, sutures (stitched...Ch. 11 - Prob. 68CRCh. 11 - In a study of memory recall, eight students from a...Ch. 11 - As part of a study to determine the effects of...Ch. 11 - Prob. 71CRCh. 11 - Prob. 72CRCh. 11 - The article Truth and DARE: Tracking Drug...Ch. 11 - The article Softball Sliding Injuries (American...Ch. 11 - Prob. 75CRCh. 11 - Wayne Gretzky was one of ice hockeys most prolific...Ch. 11 - Heres one to sink your teeth into: The authors of...Ch. 11 - Prob. 78CRCh. 11 - Dentists make many people nervous. To see whether...Ch. 11 - Prob. 80CRCh. 11 - Prob. 81CRCh. 11 - Both surface soil and subsoil specimens were taken...
Knowledge Booster


Learn more about
Need a deep-dive on the concept behind this application? Look no further. Learn more about this topic, statistics and related others by exploring similar questions and additional content below.Similar questions
- F Make a box plot from the five-number summary: 100, 105, 120, 135, 140. harrow_forward14 Is the standard deviation affected by skewed data? If so, how? foldarrow_forwardFrequency 15 Suppose that your friend believes his gambling partner plays with a loaded die (not fair). He shows you a graph of the outcomes of the games played with this die (see the following figure). Based on this graph, do you agree with this person? Why or why not? 65 Single Die Outcomes: Graph 1 60 55 50 45 40 1 2 3 4 Outcome 55 6arrow_forward
- lie y H 16 The first month's telephone bills for new customers of a certain phone company are shown in the following figure. The histogram showing the bills is misleading, however. Explain why, and suggest a solution. Frequency 140 120 100 80 60 40 20 0 0 20 40 60 80 Telephone Bill ($) 100 120arrow_forward25 ptical rule applies because t Does the empirical rule apply to the data set shown in the following figure? Explain. 2 6 5 Frequency 3 сл 2 1 0 2 4 6 8 00arrow_forward24 Line graphs typically connect the dots that represent the data values over time. If the time increments between the dots are large, explain why the line graph can be somewhat misleading.arrow_forward
- 17 Make a box plot from the five-number summary: 3, 4, 7, 16, 17. 992) waarrow_forward12 10 - 8 6 4 29 0 Interpret the shape, center and spread of the following box plot. brill smo slob.nl bagharrow_forwardSuppose that a driver's test has a mean score of 7 (out of 10 points) and standard deviation 0.5. a. Explain why you can reasonably assume that the data set of the test scores is mound-shaped. b. For the drivers taking this particular test, where should 68 percent of them score? c. Where should 95 percent of them score? d. Where should 99.7 percent of them score? Sarrow_forward
- 13 Can the mean of a data set be higher than most of the values in the set? If so, how? Can the median of a set be higher than most of the values? If so, how? srit to estaarrow_forwardA random variable X takes values 0 and 1 with probabilities q and p, respectively, with q+p=1. find the moment generating function of X and show that all the moments about the origin equal p. (Note- Please include as much detailed solution/steps in the solution to understand, Thank you!)arrow_forward1 (Expected Shortfall) Suppose the price of an asset Pt follows a normal random walk, i.e., Pt = Po+r₁ + ... + rt with r₁, r2,... being IID N(μ, o²). Po+r1+. ⚫ Suppose the VaR of rt is VaRq(rt) at level q, find the VaR of the price in T days, i.e., VaRq(Pt – Pt–T). - • If ESq(rt) = A, find ES₁(Pt – Pt–T).arrow_forward
arrow_back_ios
SEE MORE QUESTIONS
arrow_forward_ios
Recommended textbooks for you
 Glencoe Algebra 1, Student Edition, 9780079039897...AlgebraISBN:9780079039897Author:CarterPublisher:McGraw Hill
 Functions and Change: A Modeling Approach to Coll...AlgebraISBN:9781337111348Author:Bruce Crauder, Benny Evans, Alan NoellPublisher:Cengage Learning
Glencoe Algebra 1, Student Edition, 9780079039897...
Algebra
ISBN:9780079039897
Author:Carter
Publisher:McGraw Hill
Functions and Change: A Modeling Approach to Coll...
Algebra
ISBN:9781337111348
Author:Bruce Crauder, Benny Evans, Alan Noell
Publisher:Cengage Learning
Hypothesis Testing using Confidence Interval Approach; Author: BUM2413 Applied Statistics UMP;https://www.youtube.com/watch?v=Hq1l3e9pLyY;License: Standard YouTube License, CC-BY
Hypothesis Testing - Difference of Two Means - Student's -Distribution & Normal Distribution; Author: The Organic Chemistry Tutor;https://www.youtube.com/watch?v=UcZwyzwWU7o;License: Standard Youtube License