
Statistics: The Art and Science of Learning from Data (4th Edition)
4th Edition
ISBN: 9780321997838
Author: Alan Agresti, Christine A. Franklin, Bernhard Klingenberg
Publisher: PEARSON
expand_more
expand_more
format_list_bulleted
Concept explainers
Videos
Textbook Question
Chapter 11, Problem 65CP
Clarity of diamonds Does the clarity of a diamond depend on its cut? Exercise 3.4 showed data, reproduced below, on the clarity (rated as internally flawless, IF. very very slightly included, VVS, very slightly included, VS, slightly included, SI and included. I) for the two lowest ratings for cut, which are “good” and “fair.”
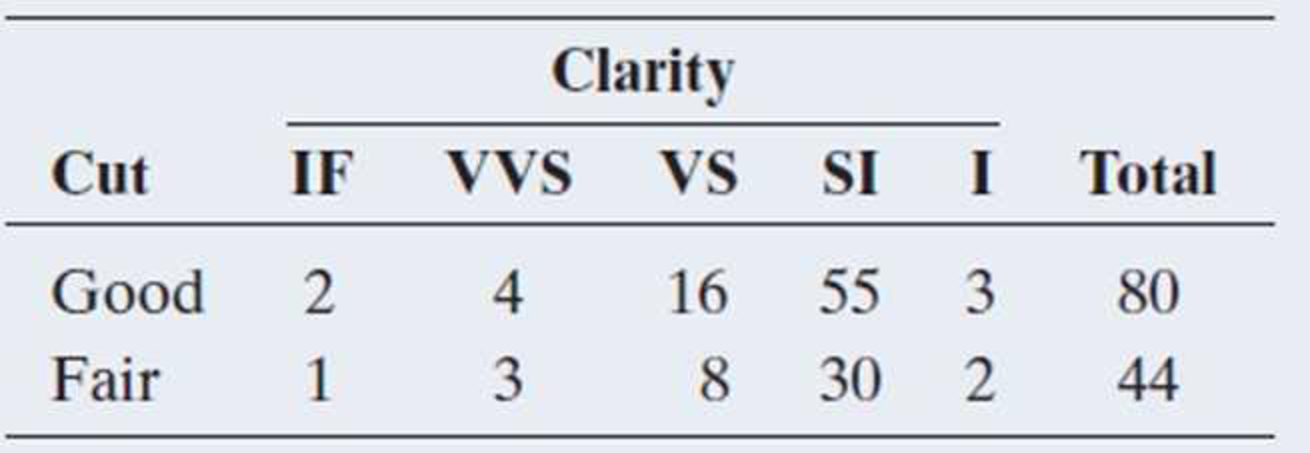
- a. Verify, using software, that X2 = 0.267 for this table. The (raw) data are available on the book’s website as Diamonds.csv.
- b. Can you use the chi-squared distribution to find a P-value? Why or why not?
- c. Of 10,000 random permutations. 9,908 resulted in an X2 value as large or larger than the one observed. Find the (approximate) permutation P-value and interpret.
- d. Use the Permutation Test of Independence web app accessible from the book’s website to enter the
contingency table and replicate the results from part c.
Expert Solution & Answer
Want to see the full answer?
Check out a sample textbook solution
Students have asked these similar questions
iid
1. The CLT provides an approximate sampling distribution for the arithmetic average Ỹ of a
random sample Y₁, . . ., Yn f(y). The parameters of the approximate sampling distribution
depend on the mean and variance of the underlying random variables (i.e., the population
mean and variance). The approximation can be written to emphasize this, using the expec-
tation and variance of one of the random variables in the sample instead of the parameters
μ, 02:
YNEY,
· (1
(EY,, varyi
n
For the following population distributions f, write the approximate distribution of the sample
mean.
(a) Exponential with rate ẞ: f(y) = ß exp{−ßy}
1
(b) Chi-square with degrees of freedom: f(y) = ( 4 ) 2 y = exp { — ½/ }
г(
(c) Poisson with rate λ: P(Y = y) = exp(-\}
>
y!
y²
2. Let Y₁,……., Y be a random sample with common mean μ and common variance σ². Use the
CLT to write an expression approximating the CDF P(Ỹ ≤ x) in terms of µ, σ² and n, and
the standard normal CDF Fz(·).
math
Chapter 11 Solutions
Statistics: The Art and Science of Learning from Data (4th Edition)
Ch. 11.1 - Gender gap in politics? In the United States, is...Ch. 11.1 - Prob. 2PBCh. 11.1 - Williams College admission Data from 2013 posted...Ch. 11.1 - Prob. 4PBCh. 11.1 - Marital happiness and income In the GSS, subjects...Ch. 11.1 - What is independent of happiness? Which one of the...Ch. 11.1 - Sample evidence about independence Refer to the...Ch. 11.2 - Life after death and gender In the 2012 GSS, 605...Ch. 11.2 - Happiness and gender For the 2 3 table on gender...Ch. 11.2 - Prob. 10PB
Ch. 11.2 - Marital happiness and income In Exercise 11.5 when...Ch. 11.2 - First and second free throw independent? In pro...Ch. 11.2 - Cigarettes and marijuana The table on the...Ch. 11.2 - Prob. 14PBCh. 11.2 - Help the environment In 2010 the GSS asked whether...Ch. 11.2 - Prob. 16PBCh. 11.2 - Aspirin and heart attacks A Swedish study used...Ch. 11.2 - z test for heart attack study Refer to the...Ch. 11.2 - Severity of fever after flu shot The study...Ch. 11.2 - Prob. 20PBCh. 11.2 - Testing a genetic theory In an experiment on...Ch. 11.2 - Birthdays by quarters Based on a random sample of...Ch. 11.2 - Checking a roulette wheel Karl Pearson devised the...Ch. 11.3 - Democrat, race, and gender The two tables show...Ch. 11.3 - Death penalty associations Table 11.10, summarized...Ch. 11.3 - Smoking and alcohol The table refers to a survey...Ch. 11.3 - Sex of victim and offender For murders in the...Ch. 11.3 - Smelling and mortality A recent study (Pinto et...Ch. 11.3 - Vioxx In September 2004, the pharmaceutical...Ch. 11.3 - Egg and cell derived vaccine When comparing the...Ch. 11.3 - Risk of dying for teenagers According to...Ch. 11.3 - Marital happiness The table shows 2012 GSS data on...Ch. 11.3 - Party ID and gender The table shows the 2012 GSS...Ch. 11.3 - Chi-squared versus measuring association For the...Ch. 11.4 - Standardized residuals for happiness and income...Ch. 11.4 - Prob. 36PBCh. 11.4 - Prob. 37PBCh. 11.4 - Prob. 38PBCh. 11.4 - Prob. 39PBCh. 11.4 - Prob. 40PBCh. 11.5 - Keeping old dogs mentally sharp In an experiment...Ch. 11.5 - Prob. 43PBCh. 11.5 - Prob. 44PBCh. 11.5 - Prob. 46PBCh. 11 - Female for president? When recent General Social...Ch. 11 - Prob. 48CPCh. 11 - Down and chi-squared For the data in the previous...Ch. 11 - Prob. 50CPCh. 11 - Prob. 51CPCh. 11 - Prob. 52CPCh. 11 - Prob. 53CPCh. 11 - Prob. 54CPCh. 11 - Prob. 55CPCh. 11 - Prob. 56CPCh. 11 - Seat belt helps? The table refers to passengers in...Ch. 11 - Prob. 58CPCh. 11 - Prob. 59CPCh. 11 - Prob. 60CPCh. 11 - Prob. 61CPCh. 11 - Prob. 62CPCh. 11 - Prob. 63CPCh. 11 - Prob. 64CPCh. 11 - Clarity of diamonds Does the clarity of a diamond...Ch. 11 - Benfords Law When looking at a collection of...Ch. 11 - Prob. 67CPCh. 11 - Prob. 68CPCh. 11 - Prob. 70CPCh. 11 - Prob. 71CPCh. 11 - Prob. 72CPCh. 11 - Prob. 73CPCh. 11 - Prob. 74CPCh. 11 - Prob. 75CPCh. 11 - Prob. 76CPCh. 11 - Prob. 77CPCh. 11 - Prob. 78CPCh. 11 - Prob. 79CPCh. 11 - Statistical versus practical significance In any...Ch. 11 - Prob. 81CPCh. 11 - Multiple response variables Each subject in a...Ch. 11 - Standardized residuals for 2 2 tables The table...Ch. 11 - Prob. 84CPCh. 11 - Prob. 85CPCh. 11 - Prob. 86CPCh. 11 - Prob. 87CPCh. 11 - Prob. 88CPCh. 11 - Voting with 16 A recent survey of Austrian high...
Knowledge Booster


Learn more about
Need a deep-dive on the concept behind this application? Look no further. Learn more about this topic, statistics and related others by exploring similar questions and additional content below.Similar questions
- Compute the median of the following data. 32, 41, 36, 42, 29, 30, 40, 22, 25, 37arrow_forwardTask Description: Read the following case study and answer the questions that follow. Ella is a 9-year-old third-grade student in an inclusive classroom. She has been diagnosed with Emotional and Behavioural Disorder (EBD). She has been struggling academically and socially due to challenges related to self-regulation, impulsivity, and emotional outbursts. Ella's behaviour includes frequent tantrums, defiance toward authority figures, and difficulty forming positive relationships with peers. Despite her challenges, Ella shows an interest in art and creative activities and demonstrates strong verbal skills when calm. Describe 2 strategies that could be implemented that could help Ella regulate her emotions in class (4 marks) Explain 2 strategies that could improve Ella’s social skills (4 marks) Identify 2 accommodations that could be implemented to support Ella academic progress and provide a rationale for your recommendation.(6 marks) Provide a detailed explanation of 2 ways…arrow_forwardQuestion 2: When John started his first job, his first end-of-year salary was $82,500. In the following years, he received salary raises as shown in the following table. Fill the Table: Fill the following table showing his end-of-year salary for each year. I have already provided the end-of-year salaries for the first three years. Calculate the end-of-year salaries for the remaining years using Excel. (If you Excel answer for the top 3 cells is not the same as the one in the following table, your formula / approach is incorrect) (2 points) Geometric Mean of Salary Raises: Calculate the geometric mean of the salary raises using the percentage figures provided in the second column named “% Raise”. (The geometric mean for this calculation should be nearly identical to the arithmetic mean. If your answer deviates significantly from the mean, it's likely incorrect. 2 points) Starting salary % Raise Raise Salary after raise 75000 10% 7500 82500 82500 4% 3300…arrow_forward
- I need help with this problem and an explanation of the solution for the image described below. (Statistics: Engineering Probabilities)arrow_forwardI need help with this problem and an explanation of the solution for the image described below. (Statistics: Engineering Probabilities)arrow_forward310015 K Question 9, 5.2.28-T Part 1 of 4 HW Score: 85.96%, 49 of 57 points Points: 1 Save of 6 Based on a poll, among adults who regret getting tattoos, 28% say that they were too young when they got their tattoos. Assume that six adults who regret getting tattoos are randomly selected, and find the indicated probability. Complete parts (a) through (d) below. a. Find the probability that none of the selected adults say that they were too young to get tattoos. 0.0520 (Round to four decimal places as needed.) Clear all Final check Feb 7 12:47 US Oarrow_forward
- how could the bar graph have been organized differently to make it easier to compare opinion changes within political partiesarrow_forwardDraw a picture of a normal distribution with mean 70 and standard deviation 5.arrow_forwardWhat do you guess are the standard deviations of the two distributions in the previous example problem?arrow_forward
- Please answer the questionsarrow_forward30. An individual who has automobile insurance from a certain company is randomly selected. Let Y be the num- ber of moving violations for which the individual was cited during the last 3 years. The pmf of Y isy | 1 2 4 8 16p(y) | .05 .10 .35 .40 .10 a.Compute E(Y).b. Suppose an individual with Y violations incurs a surcharge of $100Y^2. Calculate the expected amount of the surcharge.arrow_forward24. An insurance company offers its policyholders a num- ber of different premium payment options. For a ran- domly selected policyholder, let X = the number of months between successive payments. The cdf of X is as follows: F(x)=0.00 : x < 10.30 : 1≤x<30.40 : 3≤ x < 40.45 : 4≤ x <60.60 : 6≤ x < 121.00 : 12≤ x a. What is the pmf of X?b. Using just the cdf, compute P(3≤ X ≤6) and P(4≤ X).arrow_forward
arrow_back_ios
SEE MORE QUESTIONS
arrow_forward_ios
Recommended textbooks for you
 Glencoe Algebra 1, Student Edition, 9780079039897...AlgebraISBN:9780079039897Author:CarterPublisher:McGraw Hill
 Trigonometry (MindTap Course List)TrigonometryISBN:9781337278461Author:Ron LarsonPublisher:Cengage Learning
 Algebra & Trigonometry with Analytic GeometryAlgebraISBN:9781133382119Author:SwokowskiPublisher:Cengage
 College Algebra (MindTap Course List)AlgebraISBN:9781305652231Author:R. David Gustafson, Jeff HughesPublisher:Cengage Learning
 Functions and Change: A Modeling Approach to Coll...AlgebraISBN:9781337111348Author:Bruce Crauder, Benny Evans, Alan NoellPublisher:Cengage Learning
Glencoe Algebra 1, Student Edition, 9780079039897...
Algebra
ISBN:9780079039897
Author:Carter
Publisher:McGraw Hill
Trigonometry (MindTap Course List)
Trigonometry
ISBN:9781337278461
Author:Ron Larson
Publisher:Cengage Learning
Algebra & Trigonometry with Analytic Geometry
Algebra
ISBN:9781133382119
Author:Swokowski
Publisher:Cengage
College Algebra (MindTap Course List)
Algebra
ISBN:9781305652231
Author:R. David Gustafson, Jeff Hughes
Publisher:Cengage Learning
Functions and Change: A Modeling Approach to Coll...
Algebra
ISBN:9781337111348
Author:Bruce Crauder, Benny Evans, Alan Noell
Publisher:Cengage Learning
The Shape of Data: Distributions: Crash Course Statistics #7; Author: CrashCourse;https://www.youtube.com/watch?v=bPFNxD3Yg6U;License: Standard YouTube License, CC-BY
Shape, Center, and Spread - Module 20.2 (Part 1); Author: Mrmathblog;https://www.youtube.com/watch?v=COaid7O_Gag;License: Standard YouTube License, CC-BY
Shape, Center and Spread; Author: Emily Murdock;https://www.youtube.com/watch?v=_YyW0DSCzpM;License: Standard Youtube License