Videos
To find: the coordinates of all the vertices and determine whether the solution set bounds or not.
Answer to Problem 30E
The vertices are
The solution set is bounded
Explanation of Solution
Given:
Calculation:
We obtain the equations of the parabola and the straight line from the given inequalities:
Solving these two equations we get the intersection point of these two curves.
Substitute
Substitute
Substitute
So, the intersection points are (-2,4) and (2,4) .
Some points on the parabola
| X | -3 | -2 | 2 | 0 | 3 |
| Y | 9 | 4 | 4 | 0 | 9 |
Using these points we first draw the graph of this parabola.
We graph the straight line and the parabolas given by the equation that corresponds to the inequality. To determine the graph of the inequality, we need to check our test point. Here, we take (0,1) as test point.
| Inequality | Test point (0,1) | Conclusion |
| Satisfies inequality | ||
| Satisfies inequality |
Since (0,1) is below the line
Therefore, graph with shaded region is
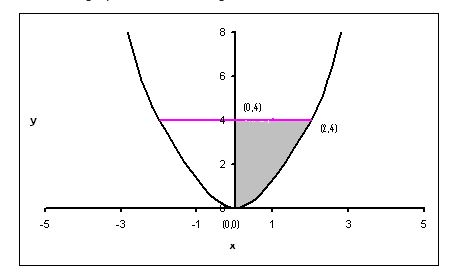
Vertices: The co-ordinate of one vertex is the point of intersection of the given line and the parabola in the first quadrant, which is clearly (2,4). The origin (0,0) is also a vertex. The other vertex is the
Therefore, the vertices are
From the figure it is clear that the shaded region is bounded. Therefore, the solution set is bounded
Conclusion:
Therefore, the vertices are
Chapter 10 Solutions
Precalculus: Mathematics for Calculus - 6th Edition


- Calculus lll May I please have the blank lines completed, and final statement defined as a result? Thank you for the support!arrow_forward3. Consider the polynomial equation 6-iz+7z² - iz³ +z = 0 for which the roots are 3i, -2i, -i, and i. (a) Verify the relations between this roots and the coefficients of the polynomial. (b) Find the annulus region in which the roots lie.arrow_forwardForce with 800 N and 400 N are acting on a machine part at 30° and 60°, respectively with the positive x axisarrow_forward
- Find the accumulated amount A, if the principal P is invested at an interest rate of r per year for t years. (Round your answer to the nearest cent.) P = $13,000, r = 6%, t = 10, compounded quarterly A = $ 31902 Need Help? Read It Watch It Viewing Saved Work Revert to Last Response SUBMIT ANSWER O/6.66 Points] DETAILS MY NOTES TANAPCALC10 5.3.003. EVIOUS ANSWERS ASK YOUR TEACHER PRACTICE ANOTHER Find the accumulated amount A, if the principal P is invested at an interest rate of r per year for t years. (Round your answer to the nearest cent.) P = $140,000, r = 8%, t = 8, compounded monthly A = $259130.20 X Need Help? Read It Watch Itarrow_forwardFind the present value of $20,000 due in 3 years at the given rate of interest. (Round your answers to the nearest cent.) (a) 2%/year compounded monthly (b) 5%/year compounded daily $ Need Help? Read It Watch It SUBMIT ANSWER [-/6.66 Points] DETAILS MY NOTES TANAPCALC10 5.3.009. ASK YOUR TEACHER PRACTICE ANC Find the accumulated amount after 3 years if $4000 is invested at 3%/year compounded continuously. (Round your answer to the nearest cent.) Need Help? Read It Watch Itarrow_forwardFind the effective rate corresponding to the given nominal rate. (Round your answers to three decimal places.) (a) 9.5%/year compounded monthly % (b) 9.5%/year compounded daily % Need Help? Read It Watch It SUBMIT ANSWER -/6.66 Points] DETAILS MY NOTES TANAPCALC10 5.3.007. ASK YOUR TEACHE Find the present value of $90,000 due in 7 years at the given rate of interest. (Round your answers to the nearest cent.) (a) 9%/year compounded semiannually (b) 9%/year compounded quarterly LAarrow_forward
- Find the accumulated amount A, if the principal P is invested at an interest rate of r per year for t years. (Round your answer to the nearest cent.) P = $160,000, r = 7%, t = 4, compounded daily A = $211113.60 Need Help? Read It SUBMIT ANSWER ASK YOUR TEACHER PRACTICE ANOTHER --/6.66 Points] DETAILS MY NOTES TANAPCALC10 5.3.005. Find the effective rate corresponding to the given nominal rate. (Round your answers to three decimal places.) (a) 8%/year compounded semiannually % (b) 9%/year compounded quarterly %arrow_forwardFind the derivative of the function. g'(t) = 9t g(t) = In(t) (9ln(t) - 1) [In(t)] 2 × Need Help? Read It Watch Itarrow_forwardFind the accumulated amount A, if the principal P is invested at an interest rate of r per year for t years. (Round your answer to the nearest cent.) P = $3800, r = 4%, t = 10, compounded semiannually A = $ 5645.60 × Need Help? Read It SUBMIT ANSWER [3.33/6.66 Points] DETAILS MY NOTES REVIOUS ANSWERS ASK YOUR TEACHER TANAPCALC10 5.3.001.EP. PRACTICE ANOTHER Consider the following where the principal P is invested at an interest rate of r per year for t years. P = $3,100, r = 4%, t = 10, compounded semiannually Determine m, the number of conversion periods per year. 2 Find the accumulated amount A (in dollars). (Round your answer to the nearest cent.) A = $ 4604.44arrow_forward
- Force with 800 N and 400 N are acting on a machine part at 30° and 60°, respectively with a positive x axis, Draw the diagram representing this situationarrow_forwardI forgot to mention to you to solve question 1 and 2. Can you solve it using all data that given in the pict i given and can you teach me about that.arrow_forwardexam review please help!arrow_forward
 Calculus: Early TranscendentalsCalculusISBN:9781285741550Author:James StewartPublisher:Cengage Learning
 Thomas' Calculus (14th Edition)CalculusISBN:9780134438986Author:Joel R. Hass, Christopher E. Heil, Maurice D. WeirPublisher:PEARSON
 Calculus: Early Transcendentals (3rd Edition)CalculusISBN:9780134763644Author:William L. Briggs, Lyle Cochran, Bernard Gillett, Eric SchulzPublisher:PEARSON
 Calculus: Early TranscendentalsCalculusISBN:9781319050740Author:Jon Rogawski, Colin Adams, Robert FranzosaPublisher:W. H. Freeman
 Calculus: Early Transcendental FunctionsCalculusISBN:9781337552516Author:Ron Larson, Bruce H. EdwardsPublisher:Cengage Learning