
EBK PRACTICE OF STAT.F/AP EXAM,UPDATED
6th Edition
ISBN: 9781319287573
Author: Starnes
Publisher: MPS PUB
expand_more
expand_more
format_list_bulleted
Concept explainers
Videos
Question
Chapter 1, Problem T1.4SPT
To determine
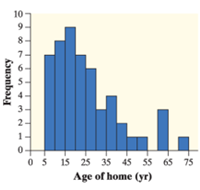
To find: the following could be the median age.
Expert Solution & Answer
Answer to Problem T1.4SPT
24 years
Explanation of Solution
Given:
Calculation:
Finding the frequency associating to each bar in the histogram
| Age of home (yr) | Frequency | C.F. |
| 5-10 | 7 | 7 |
| 10-15 | 8 | 15 |
| 15-20 | 9 | 24 |
| 20-25 | 7 | 31 |
| 25-30 | 6 | 37 |
| 30-35 | 3 | 40 |
| 35-40 | 4 | 44 |
| 40-45 | 2 | 46 |
| 45-50 | 1 | 47 |
| 50-55 | 1 | 48 |
| 55-60 | 0 | 48 |
| 60-65 | 3 | 51 |
| 65-70 | 0 | 51 |
| 70-75 | 1 | 52 |
| total | 52 |
The median is the mid value of the ascending sorted data set. It is containing 52 data values and therefore the median would be between the middle between the 26th and 27th data values. So
The answer is 24; the reason is that it is between 20 and 25
Hence, the correct option is (c)
Chapter 1 Solutions
EBK PRACTICE OF STAT.F/AP EXAM,UPDATED
Ch. 1.1 - Prob. 11ECh. 1.1 - Prob. 12ECh. 1.1 - Prob. 13ECh. 1.1 - Prob. 14ECh. 1.1 - Prob. 15ECh. 1.1 - Prob. 16ECh. 1.1 - Prob. 17ECh. 1.1 - Prob. 18ECh. 1.1 - Prob. 19ECh. 1.1 - Prob. 20E
Ch. 1.1 - Prob. 21ECh. 1.1 - Prob. 22ECh. 1.1 - Prob. 23ECh. 1.1 - Prob. 24ECh. 1.1 - Prob. 25ECh. 1.1 - Prob. 26ECh. 1.1 - Prob. 27ECh. 1.1 - Prob. 28ECh. 1.1 - Prob. 29ECh. 1.1 - Prob. 30ECh. 1.1 - Prob. 31ECh. 1.1 - Prob. 32ECh. 1.1 - Prob. 33ECh. 1.1 - Prob. 34ECh. 1.1 - Prob. 35ECh. 1.1 - Prob. 36ECh. 1.1 - Prob. 37ECh. 1.1 - Prob. 38ECh. 1.1 - Prob. 39ECh. 1.1 - Prob. 40ECh. 1.1 - Prob. 41ECh. 1.1 - Prob. 42ECh. 1.1 - Prob. 43ECh. 1.1 - Prob. 44ECh. 1.2 - Prob. 45ECh. 1.2 - Prob. 46ECh. 1.2 - Prob. 47ECh. 1.2 - Prob. 48ECh. 1.2 - Prob. 49ECh. 1.2 - Prob. 50ECh. 1.2 - Prob. 51ECh. 1.2 - Prob. 52ECh. 1.2 - Prob. 53ECh. 1.2 - Prob. 54ECh. 1.2 - Prob. 55ECh. 1.2 - Prob. 56ECh. 1.2 - Prob. 57ECh. 1.2 - Prob. 58ECh. 1.2 - Prob. 59ECh. 1.2 - Prob. 60ECh. 1.2 - Prob. 61ECh. 1.2 - Prob. 62ECh. 1.2 - Prob. 63ECh. 1.2 - Prob. 64ECh. 1.2 - Prob. 65ECh. 1.2 - Prob. 66ECh. 1.2 - Prob. 67ECh. 1.2 - Prob. 68ECh. 1.2 - Prob. 69ECh. 1.2 - Prob. 70ECh. 1.2 - Prob. 71ECh. 1.2 - Prob. 72ECh. 1.2 - Prob. 73ECh. 1.2 - Prob. 74ECh. 1.2 - Prob. 75ECh. 1.2 - Prob. 76ECh. 1.2 - Prob. 77ECh. 1.2 - Prob. 78ECh. 1.2 - Prob. 79ECh. 1.2 - Prob. 80ECh. 1.2 - Prob. 81ECh. 1.2 - Prob. 82ECh. 1.2 - Prob. 83ECh. 1.2 - Prob. 84ECh. 1.2 - Prob. 85ECh. 1.2 - Prob. 86ECh. 1.3 - Prob. 87ECh. 1.3 - Prob. 88ECh. 1.3 - Prob. 89ECh. 1.3 - Prob. 90ECh. 1.3 - Prob. 91ECh. 1.3 - Prob. 92ECh. 1.3 - Prob. 93ECh. 1.3 - Prob. 94ECh. 1.3 - Prob. 95ECh. 1.3 - Prob. 96ECh. 1.3 - Prob. 97ECh. 1.3 - Prob. 98ECh. 1.3 - Prob. 99ECh. 1.3 - Prob. 100ECh. 1.3 - Prob. 101ECh. 1.3 - Prob. 102ECh. 1.3 - Prob. 103ECh. 1.3 - Prob. 104ECh. 1.3 - Prob. 105ECh. 1.3 - Prob. 106ECh. 1.3 - Prob. 107ECh. 1.3 - Prob. 108ECh. 1.3 - Prob. 109ECh. 1.3 - Prob. 110ECh. 1.3 - Prob. 111ECh. 1.3 - Prob. 112ECh. 1.3 - Prob. 113ECh. 1.3 - Prob. 114ECh. 1.3 - Prob. 115ECh. 1.3 - Prob. 116ECh. 1.3 - Prob. 117ECh. 1.3 - Prob. 118ECh. 1.3 - Prob. 119ECh. 1.3 - Prob. 120ECh. 1.3 - Prob. 121ECh. 1.3 - Prob. 122ECh. 1.3 - Prob. 123ECh. 1.3 - Prob. 124ECh. 1.3 - Prob. 125ECh. 1.3 - Prob. 126ECh. 1.3 - Prob. 127ECh. 1.3 - Prob. 128ECh. 1 - Prob. 1ECh. 1 - Prob. 2ECh. 1 - Prob. 3ECh. 1 - Prob. 4ECh. 1 - Prob. 5ECh. 1 - Prob. 6ECh. 1 - Prob. 7ECh. 1 - Prob. 8ECh. 1 - Prob. 9ECh. 1 - Prob. 10ECh. 1 - Prob. R1.1RECh. 1 - Prob. R1.2RECh. 1 - Prob. R1.3RECh. 1 - Prob. R1.4RECh. 1 - Prob. R1.5RECh. 1 - Prob. R1.6RECh. 1 - Prob. R1.7RECh. 1 - Prob. R1.8RECh. 1 - Prob. R1.9RECh. 1 - Prob. R1.10RECh. 1 - Prob. T1.1SPTCh. 1 - Prob. T1.2SPTCh. 1 - Prob. T1.3SPTCh. 1 - Prob. T1.4SPTCh. 1 - Prob. T1.5SPTCh. 1 - Prob. T1.6SPTCh. 1 - Prob. T1.7SPTCh. 1 - Prob. T1.8SPTCh. 1 - Prob. T1.9SPTCh. 1 - Prob. T1.10SPTCh. 1 - Prob. T1.11SPTCh. 1 - Prob. T1.12SPTCh. 1 - Prob. T1.13SPTCh. 1 - Prob. T1.14SPT
Additional Math Textbook Solutions
Find more solutions based on key concepts
Boxplots. In Exercises 29-32, use the given data to construct a boxplot and identify the 5-number summary.
29. ...
Elementary Statistics (13th Edition)
What is the domain and the range of y=secx ?
Precalculus
CHECK POINT I Express as a percent.
Thinking Mathematically (6th Edition)
Finding the Margin of Error In Exercises 33 and 34, use the confidence interval to find the estimated margin of...
Elementary Statistics: Picturing the World (7th Edition)
2. Source of Data In conducting a statistical study, why is it important to consider the source of the data?
Elementary Statistics
Find the point-slope form of the line passing through the given points. Use the first point as (x1, .y1). Plot ...
College Algebra with Modeling & Visualization (5th Edition)
Knowledge Booster


Learn more about
Need a deep-dive on the concept behind this application? Look no further. Learn more about this topic, statistics and related others by exploring similar questions and additional content below.Similar questions
- For a binary asymmetric channel with Py|X(0|1) = 0.1 and Py|X(1|0) = 0.2; PX(0) = 0.4 isthe probability of a bit of “0” being transmitted. X is the transmitted digit, and Y is the received digit.a. Find the values of Py(0) and Py(1).b. What is the probability that only 0s will be received for a sequence of 10 digits transmitted?c. What is the probability that 8 1s and 2 0s will be received for the same sequence of 10 digits?d. What is the probability that at least 5 0s will be received for the same sequence of 10 digits?arrow_forwardV2 360 Step down + I₁ = I2 10KVA 120V 10KVA 1₂ = 360-120 or 2nd Ratio's V₂ m 120 Ratio= 360 √2 H I2 I, + I2 120arrow_forwardQ2. [20 points] An amplitude X of a Gaussian signal x(t) has a mean value of 2 and an RMS value of √(10), i.e. square root of 10. Determine the PDF of x(t).arrow_forward
- In a network with 12 links, one of the links has failed. The failed link is randomlylocated. An electrical engineer tests the links one by one until the failed link is found.a. What is the probability that the engineer will find the failed link in the first test?b. What is the probability that the engineer will find the failed link in five tests?Note: You should assume that for Part b, the five tests are done consecutively.arrow_forwardProblem 3. Pricing a multi-stock option the Margrabe formula The purpose of this problem is to price a swap option in a 2-stock model, similarly as what we did in the example in the lectures. We consider a two-dimensional Brownian motion given by W₁ = (W(¹), W(2)) on a probability space (Q, F,P). Two stock prices are modeled by the following equations: dX = dY₁ = X₁ (rdt+ rdt+0₁dW!) (²)), Y₁ (rdt+dW+0zdW!"), with Xo xo and Yo =yo. This corresponds to the multi-stock model studied in class, but with notation (X+, Y₁) instead of (S(1), S(2)). Given the model above, the measure P is already the risk-neutral measure (Both stocks have rate of return r). We write σ = 0₁+0%. We consider a swap option, which gives you the right, at time T, to exchange one share of X for one share of Y. That is, the option has payoff F=(Yr-XT). (a) We first assume that r = 0 (for questions (a)-(f)). Write an explicit expression for the process Xt. Reminder before proceeding to question (b): Girsanov's theorem…arrow_forwardProblem 1. Multi-stock model We consider a 2-stock model similar to the one studied in class. Namely, we consider = S(1) S(2) = S(¹) exp (σ1B(1) + (M1 - 0/1 ) S(²) exp (02B(2) + (H₂- M2 where (B(¹) ) +20 and (B(2) ) +≥o are two Brownian motions, with t≥0 Cov (B(¹), B(2)) = p min{t, s}. " The purpose of this problem is to prove that there indeed exists a 2-dimensional Brownian motion (W+)+20 (W(1), W(2))+20 such that = S(1) S(2) = = S(¹) exp (011W(¹) + (μ₁ - 01/1) t) 롱) S(²) exp (021W (1) + 022W(2) + (112 - 03/01/12) t). where σ11, 21, 22 are constants to be determined (as functions of σ1, σ2, p). Hint: The constants will follow the formulas developed in the lectures. (a) To show existence of (Ŵ+), first write the expression for both W. (¹) and W (2) functions of (B(1), B(²)). as (b) Using the formulas obtained in (a), show that the process (WA) is actually a 2- dimensional standard Brownian motion (i.e. show that each component is normal, with mean 0, variance t, and that their…arrow_forward
- The scores of 8 students on the midterm exam and final exam were as follows. Student Midterm Final Anderson 98 89 Bailey 88 74 Cruz 87 97 DeSana 85 79 Erickson 85 94 Francis 83 71 Gray 74 98 Harris 70 91 Find the value of the (Spearman's) rank correlation coefficient test statistic that would be used to test the claim of no correlation between midterm score and final exam score. Round your answer to 3 places after the decimal point, if necessary. Test statistic: rs =arrow_forwardBusiness discussarrow_forwardBusiness discussarrow_forward
arrow_back_ios
SEE MORE QUESTIONS
arrow_forward_ios
Recommended textbooks for you
 MATLAB: An Introduction with ApplicationsStatisticsISBN:9781119256830Author:Amos GilatPublisher:John Wiley & Sons Inc
 Probability and Statistics for Engineering and th...StatisticsISBN:9781305251809Author:Jay L. DevorePublisher:Cengage Learning
 Statistics for The Behavioral Sciences (MindTap C...StatisticsISBN:9781305504912Author:Frederick J Gravetter, Larry B. WallnauPublisher:Cengage Learning
 Elementary Statistics: Picturing the World (7th E...StatisticsISBN:9780134683416Author:Ron Larson, Betsy FarberPublisher:PEARSON
 The Basic Practice of StatisticsStatisticsISBN:9781319042578Author:David S. Moore, William I. Notz, Michael A. FlignerPublisher:W. H. Freeman
 Introduction to the Practice of StatisticsStatisticsISBN:9781319013387Author:David S. Moore, George P. McCabe, Bruce A. CraigPublisher:W. H. Freeman
MATLAB: An Introduction with Applications
Statistics
ISBN:9781119256830
Author:Amos Gilat
Publisher:John Wiley & Sons Inc
Probability and Statistics for Engineering and th...
Statistics
ISBN:9781305251809
Author:Jay L. Devore
Publisher:Cengage Learning
Statistics for The Behavioral Sciences (MindTap C...
Statistics
ISBN:9781305504912
Author:Frederick J Gravetter, Larry B. Wallnau
Publisher:Cengage Learning
Elementary Statistics: Picturing the World (7th E...
Statistics
ISBN:9780134683416
Author:Ron Larson, Betsy Farber
Publisher:PEARSON
The Basic Practice of Statistics
Statistics
ISBN:9781319042578
Author:David S. Moore, William I. Notz, Michael A. Fligner
Publisher:W. H. Freeman
Introduction to the Practice of Statistics
Statistics
ISBN:9781319013387
Author:David S. Moore, George P. McCabe, Bruce A. Craig
Publisher:W. H. Freeman
The Shape of Data: Distributions: Crash Course Statistics #7; Author: CrashCourse;https://www.youtube.com/watch?v=bPFNxD3Yg6U;License: Standard YouTube License, CC-BY
Shape, Center, and Spread - Module 20.2 (Part 1); Author: Mrmathblog;https://www.youtube.com/watch?v=COaid7O_Gag;License: Standard YouTube License, CC-BY
Shape, Center and Spread; Author: Emily Murdock;https://www.youtube.com/watch?v=_YyW0DSCzpM;License: Standard Youtube License