
EBK PRACTICE OF STAT.F/AP EXAM,UPDATED
6th Edition
ISBN: 9781319287573
Author: Starnes
Publisher: MPS PUB
expand_more
expand_more
format_list_bulleted
Videos
Question
Chapter 1.1, Problem 37E
To determine
To find : values of a, b, c and d
Expert Solution & Answer
Answer to Problem 37E
a=50,b=0,c=10,d=40
a=20,b=30,c=40,d=10
Explanation of Solution
Given information : Row and column totals for a two-way table with two rows and two columns.
Calculation :
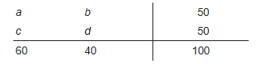
Take a=50,b=0,c=10,d=40
So,
a+c=50+10=60
b+d=0+40=40
a+b=50+0=50
c+d=10+40=50
Take a=20,b=30,c=40,d=10
So,
a+c=20+40=60
b+d=30+10=40
a+b=20+30=50
c+d=40+10=50
Chapter 1 Solutions
EBK PRACTICE OF STAT.F/AP EXAM,UPDATED
Ch. 1.1 - Prob. 11ECh. 1.1 - Prob. 12ECh. 1.1 - Prob. 13ECh. 1.1 - Prob. 14ECh. 1.1 - Prob. 15ECh. 1.1 - Prob. 16ECh. 1.1 - Prob. 17ECh. 1.1 - Prob. 18ECh. 1.1 - Prob. 19ECh. 1.1 - Prob. 20E
Ch. 1.1 - Prob. 21ECh. 1.1 - Prob. 22ECh. 1.1 - Prob. 23ECh. 1.1 - Prob. 24ECh. 1.1 - Prob. 25ECh. 1.1 - Prob. 26ECh. 1.1 - Prob. 27ECh. 1.1 - Prob. 28ECh. 1.1 - Prob. 29ECh. 1.1 - Prob. 30ECh. 1.1 - Prob. 31ECh. 1.1 - Prob. 32ECh. 1.1 - Prob. 33ECh. 1.1 - Prob. 34ECh. 1.1 - Prob. 35ECh. 1.1 - Prob. 36ECh. 1.1 - Prob. 37ECh. 1.1 - Prob. 38ECh. 1.1 - Prob. 39ECh. 1.1 - Prob. 40ECh. 1.1 - Prob. 41ECh. 1.1 - Prob. 42ECh. 1.1 - Prob. 43ECh. 1.1 - Prob. 44ECh. 1.2 - Prob. 45ECh. 1.2 - Prob. 46ECh. 1.2 - Prob. 47ECh. 1.2 - Prob. 48ECh. 1.2 - Prob. 49ECh. 1.2 - Prob. 50ECh. 1.2 - Prob. 51ECh. 1.2 - Prob. 52ECh. 1.2 - Prob. 53ECh. 1.2 - Prob. 54ECh. 1.2 - Prob. 55ECh. 1.2 - Prob. 56ECh. 1.2 - Prob. 57ECh. 1.2 - Prob. 58ECh. 1.2 - Prob. 59ECh. 1.2 - Prob. 60ECh. 1.2 - Prob. 61ECh. 1.2 - Prob. 62ECh. 1.2 - Prob. 63ECh. 1.2 - Prob. 64ECh. 1.2 - Prob. 65ECh. 1.2 - Prob. 66ECh. 1.2 - Prob. 67ECh. 1.2 - Prob. 68ECh. 1.2 - Prob. 69ECh. 1.2 - Prob. 70ECh. 1.2 - Prob. 71ECh. 1.2 - Prob. 72ECh. 1.2 - Prob. 73ECh. 1.2 - Prob. 74ECh. 1.2 - Prob. 75ECh. 1.2 - Prob. 76ECh. 1.2 - Prob. 77ECh. 1.2 - Prob. 78ECh. 1.2 - Prob. 79ECh. 1.2 - Prob. 80ECh. 1.2 - Prob. 81ECh. 1.2 - Prob. 82ECh. 1.2 - Prob. 83ECh. 1.2 - Prob. 84ECh. 1.2 - Prob. 85ECh. 1.2 - Prob. 86ECh. 1.3 - Prob. 87ECh. 1.3 - Prob. 88ECh. 1.3 - Prob. 89ECh. 1.3 - Prob. 90ECh. 1.3 - Prob. 91ECh. 1.3 - Prob. 92ECh. 1.3 - Prob. 93ECh. 1.3 - Prob. 94ECh. 1.3 - Prob. 95ECh. 1.3 - Prob. 96ECh. 1.3 - Prob. 97ECh. 1.3 - Prob. 98ECh. 1.3 - Prob. 99ECh. 1.3 - Prob. 100ECh. 1.3 - Prob. 101ECh. 1.3 - Prob. 102ECh. 1.3 - Prob. 103ECh. 1.3 - Prob. 104ECh. 1.3 - Prob. 105ECh. 1.3 - Prob. 106ECh. 1.3 - Prob. 107ECh. 1.3 - Prob. 108ECh. 1.3 - Prob. 109ECh. 1.3 - Prob. 110ECh. 1.3 - Prob. 111ECh. 1.3 - Prob. 112ECh. 1.3 - Prob. 113ECh. 1.3 - Prob. 114ECh. 1.3 - Prob. 115ECh. 1.3 - Prob. 116ECh. 1.3 - Prob. 117ECh. 1.3 - Prob. 118ECh. 1.3 - Prob. 119ECh. 1.3 - Prob. 120ECh. 1.3 - Prob. 121ECh. 1.3 - Prob. 122ECh. 1.3 - Prob. 123ECh. 1.3 - Prob. 124ECh. 1.3 - Prob. 125ECh. 1.3 - Prob. 126ECh. 1.3 - Prob. 127ECh. 1.3 - Prob. 128ECh. 1 - Prob. 1ECh. 1 - Prob. 2ECh. 1 - Prob. 3ECh. 1 - Prob. 4ECh. 1 - Prob. 5ECh. 1 - Prob. 6ECh. 1 - Prob. 7ECh. 1 - Prob. 8ECh. 1 - Prob. 9ECh. 1 - Prob. 10ECh. 1 - Prob. R1.1RECh. 1 - Prob. R1.2RECh. 1 - Prob. R1.3RECh. 1 - Prob. R1.4RECh. 1 - Prob. R1.5RECh. 1 - Prob. R1.6RECh. 1 - Prob. R1.7RECh. 1 - Prob. R1.8RECh. 1 - Prob. R1.9RECh. 1 - Prob. R1.10RECh. 1 - Prob. T1.1SPTCh. 1 - Prob. T1.2SPTCh. 1 - Prob. T1.3SPTCh. 1 - Prob. T1.4SPTCh. 1 - Prob. T1.5SPTCh. 1 - Prob. T1.6SPTCh. 1 - Prob. T1.7SPTCh. 1 - Prob. T1.8SPTCh. 1 - Prob. T1.9SPTCh. 1 - Prob. T1.10SPTCh. 1 - Prob. T1.11SPTCh. 1 - Prob. T1.12SPTCh. 1 - Prob. T1.13SPTCh. 1 - Prob. T1.14SPT
Additional Math Textbook Solutions
Find more solutions based on key concepts
Classifying Types of Probability In Exercises 53–58, classify the statement as an example of classical probabil...
Elementary Statistics: Picturing the World (7th Edition)
Fill in each blank so that the resulting statement is true. An equation that expresses a relationship between t...
Algebra and Trigonometry (6th Edition)
Earnings A sociologist says, “Typically, men in the United States still earn more than women.” What does this s...
Introductory Statistics
In hypothesis testing, the common level of significance is =0.05. Some might argue for a level of significance ...
Basic Business Statistics, Student Value Edition
Express the limits in Exercises 1–8 as definite integrals.
1. , where P is a partition of [0, 2]
University Calculus: Early Transcendentals (4th Edition)
Knowledge Booster


Learn more about
Need a deep-dive on the concept behind this application? Look no further. Learn more about this topic, statistics and related others by exploring similar questions and additional content below.Similar questions
- Questions An insurance company's cumulative incurred claims for the last 5 accident years are given in the following table: Development Year Accident Year 0 2018 1 2 3 4 245 267 274 289 292 2019 255 276 288 294 2020 265 283 292 2021 263 278 2022 271 It can be assumed that claims are fully run off after 4 years. The premiums received for each year are: Accident Year Premium 2018 306 2019 312 2020 318 2021 326 2022 330 You do not need to make any allowance for inflation. 1. (a) Calculate the reserve at the end of 2022 using the basic chain ladder method. (b) Calculate the reserve at the end of 2022 using the Bornhuetter-Ferguson method. 2. Comment on the differences in the reserves produced by the methods in Part 1.arrow_forwardA population that is uniformly distributed between a=0and b=10 is given in sample sizes 50( ), 100( ), 250( ), and 500( ). Find the sample mean and the sample standard deviations for the given data. Compare your results to the average of means for a sample of size 10, and use the empirical rules to analyze the sampling error. For each sample, also find the standard error of the mean using formula given below. Standard Error of the Mean =sigma/Root Complete the following table with the results from the sampling experiment. (Round to four decimal places as needed.) Sample Size Average of 8 Sample Means Standard Deviation of 8 Sample Means Standard Error 50 100 250 500arrow_forwardA survey of 250250 young professionals found that two dash thirdstwo-thirds of them use their cell phones primarily for e-mail. Can you conclude statistically that the population proportion who use cell phones primarily for e-mail is less than 0.720.72? Use a 95% confidence interval. Question content area bottom Part 1 The 95% confidence interval is left bracket nothing comma nothing right bracket0.60820.6082, 0.72510.7251. As 0.720.72 is within the limits of the confidence interval, we cannot conclude that the population proportion is less than 0.720.72. (Use ascending order. Round to four decimal places as needed.)arrow_forward
- I need help with this problem and an explanation of the solution for the image described below. (Statistics: Engineering Probabilities)arrow_forwardA survey of 250 young professionals found that two-thirds of them use their cell phones primarily for e-mail. Can you conclude statistically that the population proportion who use cell phones primarily for e-mail is less than 0.72? Use a 95% confidence interval. Question content area bottom Part 1 The 95% confidence interval is [ ], [ ] As 0.72 is ▼ above the upper limit within the limits below the lower limit of the confidence interval, we ▼ can cannot conclude that the population proportion is less than 0.72. (Use ascending order. Round to four decimal places as needed.)arrow_forwardI need help with this problem and an explanation of the solution for the image described below. (Statistics: Engineering Probabilities)arrow_forward
- I need help with this problem and an explanation of the solution for the image described below. (Statistics: Engineering Probabilities)arrow_forwardI need help with this problem and an explanation of the solution for the image described below. (Statistics: Engineering Probabilities)arrow_forwardQuestions An insurance company's cumulative incurred claims for the last 5 accident years are given in the following table: Development Year Accident Year 0 2018 1 2 3 4 245 267 274 289 292 2019 255 276 288 294 2020 265 283 292 2021 263 278 2022 271 It can be assumed that claims are fully run off after 4 years. The premiums received for each year are: Accident Year Premium 2018 306 2019 312 2020 318 2021 326 2022 330 You do not need to make any allowance for inflation. 1. (a) Calculate the reserve at the end of 2022 using the basic chain ladder method. (b) Calculate the reserve at the end of 2022 using the Bornhuetter-Ferguson method. 2. Comment on the differences in the reserves produced by the methods in Part 1.arrow_forward
- Questions An insurance company's cumulative incurred claims for the last 5 accident years are given in the following table: Development Year Accident Year 0 2018 1 2 3 4 245 267 274 289 292 2019 255 276 288 294 2020 265 283 292 2021 263 278 2022 271 It can be assumed that claims are fully run off after 4 years. The premiums received for each year are: Accident Year Premium 2018 306 2019 312 2020 318 2021 326 2022 330 You do not need to make any allowance for inflation. 1. (a) Calculate the reserve at the end of 2022 using the basic chain ladder method. (b) Calculate the reserve at the end of 2022 using the Bornhuetter-Ferguson method. 2. Comment on the differences in the reserves produced by the methods in Part 1.arrow_forwardFrom a sample of 26 graduate students, the mean number of months of work experience prior to entering an MBA program was 34.67. The national standard deviation is known to be18 months. What is a 90% confidence interval for the population mean? Question content area bottom Part 1 A 9090% confidence interval for the population mean is left bracket nothing comma nothing right bracketenter your response here,enter your response here. (Use ascending order. Round to two decimal places as needed.)arrow_forwardA test consists of 10 questions made of 5 answers with only one correct answer. To pass the test, a student must answer at least 8 questions correctly. (a) If a student guesses on each question, what is the probability that the student passes the test? (b) Find the mean and standard deviation of the number of correct answers. (c) Is it unusual for a student to pass the test by guessing? Explain.arrow_forward
arrow_back_ios
SEE MORE QUESTIONS
arrow_forward_ios
Recommended textbooks for you
 MATLAB: An Introduction with ApplicationsStatisticsISBN:9781119256830Author:Amos GilatPublisher:John Wiley & Sons Inc
 Probability and Statistics for Engineering and th...StatisticsISBN:9781305251809Author:Jay L. DevorePublisher:Cengage Learning
 Statistics for The Behavioral Sciences (MindTap C...StatisticsISBN:9781305504912Author:Frederick J Gravetter, Larry B. WallnauPublisher:Cengage Learning
 Elementary Statistics: Picturing the World (7th E...StatisticsISBN:9780134683416Author:Ron Larson, Betsy FarberPublisher:PEARSON
 The Basic Practice of StatisticsStatisticsISBN:9781319042578Author:David S. Moore, William I. Notz, Michael A. FlignerPublisher:W. H. Freeman
 Introduction to the Practice of StatisticsStatisticsISBN:9781319013387Author:David S. Moore, George P. McCabe, Bruce A. CraigPublisher:W. H. Freeman
MATLAB: An Introduction with Applications
Statistics
ISBN:9781119256830
Author:Amos Gilat
Publisher:John Wiley & Sons Inc
Probability and Statistics for Engineering and th...
Statistics
ISBN:9781305251809
Author:Jay L. Devore
Publisher:Cengage Learning
Statistics for The Behavioral Sciences (MindTap C...
Statistics
ISBN:9781305504912
Author:Frederick J Gravetter, Larry B. Wallnau
Publisher:Cengage Learning
Elementary Statistics: Picturing the World (7th E...
Statistics
ISBN:9780134683416
Author:Ron Larson, Betsy Farber
Publisher:PEARSON
The Basic Practice of Statistics
Statistics
ISBN:9781319042578
Author:David S. Moore, William I. Notz, Michael A. Fligner
Publisher:W. H. Freeman
Introduction to the Practice of Statistics
Statistics
ISBN:9781319013387
Author:David S. Moore, George P. McCabe, Bruce A. Craig
Publisher:W. H. Freeman
Hypothesis Testing using Confidence Interval Approach; Author: BUM2413 Applied Statistics UMP;https://www.youtube.com/watch?v=Hq1l3e9pLyY;License: Standard YouTube License, CC-BY
Hypothesis Testing - Difference of Two Means - Student's -Distribution & Normal Distribution; Author: The Organic Chemistry Tutor;https://www.youtube.com/watch?v=UcZwyzwWU7o;License: Standard Youtube License