
Concept explainers
Videos
a.
To find the distribution of superpower preferencefor the students in the sample from each country (the United States and the United Kingdom).To make a segmented bar graph to compare these distributions.
a.
Answer to Problem 30E
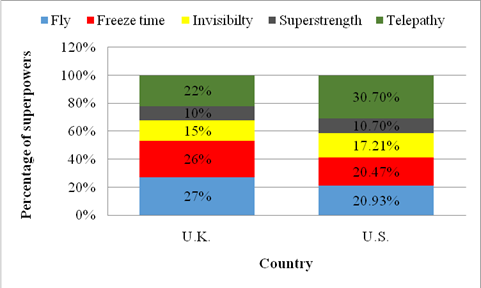
The result for the distribution of superpower preferencefor the students in the sample from each country (the United States and the United Kingdom)is as below:
| Superpower | Country | |
| U.K. | U.S. | |
| Fly | 27% | 20.93% |
| Freeze time | 26% | 20.47% |
| Invisibility | 15% | 17.21% |
| Superstrength | 10% | 10.70% |
| Telepathy | 22% | 30.70% |
The segmented bar graph to compare these distributions is as below:
Explanation of Solution
Given:
The study includes 415 children from the United Kingdom and the United States who completed a survey in a recent year. Each students countryof origin was recorded along with which superpower they would most like to have: theability to fly, ability to freeze time, invisibility, superstrength, or telepathy (ability to readminds). The data are summarized in the following table.
| Superpower | Country | |
| U.K. | U.S. | |
| Fly | 54 | 45 |
| Freeze time | 52 | 44 |
| Invisibility | 30 | 37 |
| Superstrength | 20 | 23 |
| Telepathy | 44 | 66 |
Concept Used:
Let us first determine the column total of each column, which is the sum of all counts in the corresponding column. Then determine the distribution of superpower preference from each country, by dividing the counts by the column total. Finally, make a segmented bar graph to compare these distributions.
Calculation:
Determine the column total of each column from the given table.
| Superpower | Country | |
| U.K. | U.S. | |
| Fly | 54 | 45 |
| Freeze time | 52 | 44 |
| Invisibility | 30 | 37 |
| Superstrength | 20 | 23 |
| Telepathy | 44 | 66 |
| Column Total | ||
Determine the distribution of superpower preference from each country,by dividing the counts by the column total as shown in the below table:
| Superpower | Country | |
| U.K. | U.S. | |
| Fly | ||
| Freeze time | ||
| Invisibility | ||
| Superstrength | ||
| Telepathy | ||
Create a segmented bar graph, where in the width of each bars should be equal and the height should be equal to the percentage of superpowers as shown below.

b.
To describe the association between country of origin and superpower preferencefor the students in the sample from the segmented bar graph obtained in part (a).
b.
Answer to Problem 30E
We note that the most popular superpower in the U.S. appears to be telepathy, while the most popular superpowers in the U.K. appear to be freeze time and fly.
We also note that the superstrength appears to be the least popular superpower in both the countries.
Explanation of Solution
We note that the most popular superpower in the U.S. appears to be telepathy, while the most popular superpowers in the U.K. appear to be freeze time and fly as shown from the bar graph obtained in part (a).
We also note that the superstrength appears to be the least popular superpower in both the countriesas shown from the bar graph obtained in part (a).
Chapter 1 Solutions
EBK PRACTICE OF STAT.F/AP EXAM,UPDATED
Additional Math Textbook Solutions
Calculus: Early Transcendentals (2nd Edition)
Pre-Algebra Student Edition
A First Course in Probability (10th Edition)
A Problem Solving Approach To Mathematics For Elementary School Teachers (13th Edition)
Elementary Statistics (13th Edition)
College Algebra (7th Edition)


- help me with ab please. please handwrite if possible. please don't use AI tools to answerarrow_forwardhelp me with ab please. please handwrite if possible. please don't use AI tools to answerarrow_forwardhelp me with abcd please. please handwrite if possible. please don't use AI tools to answerarrow_forward
- help me with abc please. please handwrite if possible. please don't use AI tools to answerarrow_forwardhelp me with abc please. please handwrite if possible. please don't use AI tools to answerarrow_forwardhelp me with abc please. please handwrite if possible. please don't use AI tools to answer.arrow_forward
- Please help me with this statistics questionarrow_forwardPlease help me with the following statistic questionarrow_forwardTo evaluate the success of a 1-year experimental program designed to increase the mathematical achievement of underprivileged high school seniors, a random sample of participants in the program will be selected and their mathematics scores will be compared with the previous year’s statewide average of 525 for underprivileged seniors. The researchers want to determine whether the experimental program has increased the mean achievement level over the previous year’s statewide average. If alpha=.05, what sample size is needed to have a probability of Type II error of at most .025 if the actual mean is increased to 550? From previous results, sigma=80.arrow_forward
- Please help me answer the following questions from this problem.arrow_forwardPlease help me find the sample variance for this question.arrow_forwardCrumbs Cookies was interested in seeing if there was an association between cookie flavor and whether or not there was frosting. Given are the results of the last week's orders. Frosting No Frosting Total Sugar Cookie 50 Red Velvet 66 136 Chocolate Chip 58 Total 220 400 Which category has the greatest joint frequency? Chocolate chip cookies with frosting Sugar cookies with no frosting Chocolate chip cookies Cookies with frostingarrow_forward
 MATLAB: An Introduction with ApplicationsStatisticsISBN:9781119256830Author:Amos GilatPublisher:John Wiley & Sons Inc
 Probability and Statistics for Engineering and th...StatisticsISBN:9781305251809Author:Jay L. DevorePublisher:Cengage Learning
 Statistics for The Behavioral Sciences (MindTap C...StatisticsISBN:9781305504912Author:Frederick J Gravetter, Larry B. WallnauPublisher:Cengage Learning
 Elementary Statistics: Picturing the World (7th E...StatisticsISBN:9780134683416Author:Ron Larson, Betsy FarberPublisher:PEARSON
 The Basic Practice of StatisticsStatisticsISBN:9781319042578Author:David S. Moore, William I. Notz, Michael A. FlignerPublisher:W. H. Freeman
 Introduction to the Practice of StatisticsStatisticsISBN:9781319013387Author:David S. Moore, George P. McCabe, Bruce A. CraigPublisher:W. H. Freeman