Videos
i.
Calculate the mean, median and mode for given classes.
i.
Answer to Problem 13.1MPS
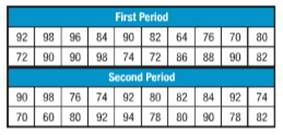
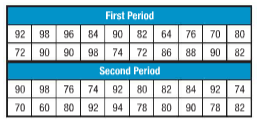
For first period,
Mean =83.7
Median = 85
Mode = 90
For second period,
Mean =82.3
Median = 81
Mode = 92
Explanation of Solution
Given:

Calculations:
Here, we have to calculate mean, median and mode for given data.
Mean is the average of given set of data.
Mean for first period is
Mean for second period is
Median is the centered value of given data.
Median for first period is
64, 70, 72, 72, 74, 76, 80, 82, 82, 84, 86, 88, 90, 90, 90, 90, 92, 96, 98, 98
Median is the centered value of given data.
Median for first period is
60, 70, 74, 74, 76, 78, 78, 80, 80, 80, 82, 82, 84, 90, 90, 92, 92, 92, 94, 98
Mode is the frequent value in given data.
Thus, in first period, 90 is mode.
In second period, 92 is mode.
Conclusion:
Therefore, we are able to find mean, median and mode of given data.
ii.
Draw stem and leaf plot for given data.
ii.
Answer to Problem 13.1MPS
Back to back stem and leaf plot for given data is
| First period | Stem | Second period |
| 4 | 6 | 0 |
| 6 4 2 2 0 | 7 | 0 4 4 6 8 8 |
| 8 6 4 2 2 0 | 8 | 0 0 0 2 2 4 |
| 8 8 6 2 0 0 0 0 | 9 | 0 0 2 2 2 4 8 |
Explanation of Solution
Given:

Calculations:
Stem and leaf plots shows the frequency of given data.
There are two parts of this plot namely stem and leaf. Stem shows first digit and leaf shows last digit.
We have given two different data. For this we has to draw back to back stem and leaf plot.
| First period | Stem | Second period |
| 4 | 6 | 0 |
| 6 4 2 2 0 | 7 | 0 4 4 6 8 8 |
| 8 6 4 2 2 0 | 8 | 0 0 0 2 2 4 |
| 8 8 6 2 0 0 0 0 | 9 | 0 0 2 2 2 4 8 |
Conclusion:
Therefore, we are able to draw back to back stem and leaf plot.
iii.
Calculate measures of variation for given data.

iii.
Answer to Problem 13.1MPS
Measures of variation for given data is,
| Measures of variation | First period | Second period |
| Range | 34 | 38 |
| Median | 75 | 81 |
| Upper Quartile | 75 | 77 |
| Lower Quartile | 90 | 91 |
| Interquartile range | 15 | 14 |
Explanation of Solution
Given:

Calculations:
Here, we have to calculate measures of variation and outlier for given set of data.
Measures of variation include range, upper quartile, lower quartile and interquartile range of given data.
Range is the difference between higher and lower data value.
Here, (Range) Firstperiod = 98-64 = 34
(Range)Secondperiod = 98-60 = 38
Median for first period is 85 and for second order is 81.
Upper quartile is the median of upper half set of data.
Here, (Upper quartile)Firstperiod is,
(Upper quartile)Secondperiod is,
Lower quartile is the median of lower half set of data.
Here, (lower quartile) Firstperiod is,
(Lower quartile)Secondperiod is,
Interquartile range is the difference between upper quartile and lower quartile.
Here, (Interquartile range) Firstperiod =90-75=15
(Interquartile range)Secondperiod =91-77=14
Conclusion:
Therefore, we are able to find measures of variation for given data.
Chapter SH Solutions
Pre-Algebra, Student Edition
Additional Math Textbook Solutions
Introductory Statistics
Elementary Statistics: Picturing the World (7th Edition)
College Algebra (7th Edition)
Elementary Statistics
Calculus: Early Transcendentals (2nd Edition)


- Kate, Luke, Mary and Nancy are sharing a cake. The cake had previously been divided into four slices (s1, s2, s3 and s4). The following table shows the values of the slices in the eyes of each player. What is fair share to nancy? S1 S2 S3 S4 Kate $4.00 $6.00 $6.00 $4.00 Luke $5.30 $5.00 $5.25 $5.45 Mary $4.25 $4.50 $3.50 $3.75 Nancy $6.00 $4.00 $4.00 $6.00arrow_forwardKate, Luke, Mary and Nancy are sharing a cake. The cake had previously been divided into four slices (s1, s2, s3 and s4). The following table shows the values of the slices in the eyes of each player. S1 S2 S3 S4 Kate $4.00 $6.00 $6.00 $4.00 Luke $5.30 $5.00 $5.25 $5.45 Mary $4.25 $4.50 $3.50 $3.75 Nancy $6.00 $4.00 $4.00 $6.00 how much is the cak worth to maryarrow_forwardKate, Luke, Mary and Nancy are sharing a cake. The cake had previously been divided into four slices (s1, s2, s3 and s4). The following table shows the values of the slices in the eyes of each player. What is the threshold of fair share for Luke? S1 S2 S3 S4 Kate $4.00 $6.00 $6.00 $4.00 Luke $5.30 $5.00 $5.25 $5.45 Mary $4.25 $4.50 $3.50 $3.75 Nancy $6.00 $4.00 $4.00 $6.00arrow_forward
- 2. A microwave manufacturing firm has determined that their profit function is P(x)=-0.0014x+0.3x²+6x-355 , where is the number of microwaves sold annually. a. Graph the profit function using a calculator. b. Determine a reasonable viewing window for the function. c. Approximate all of the zeros of the function using the CALC menu of your calculator. d. What must be the range of microwaves sold in order for the firm to profit?arrow_forwardA clothing manufacturer's profitability can be modeled by p (x)=-x4 + 40x² - 144, where .x is the number of items sold in thousands and p (x) is the company's profit in thousands of dollars. a. Sketch the function on your calculator and describe the end behavior. b. Determine the zeros of the function. c. Between what two values should the company sell in order to be profitable? d. Explain why only two of the zeros are considered in part c.arrow_forwardCCSS REASONING The number of subscribers using pagers in the United States can be modeled by f(x) = 0.015x4 -0.44x³ +3.46x² - 2.7x+9.68 where x is the number of years after 1990 and f(x) is the number of subscribers in millions. a. Graph the function. b. Describe the end behavior of the graph. c. What does the end behavior suggest about the number of pager subscribers? d. Will this trend continue indefinitely? Explain your reasoning.arrow_forward
- Can you help me solve this?arrow_forwardName Assume there is the following simplified grade book: Homework Labs | Final Exam | Project Avery 95 98 90 100 Blake 90 96 Carlos 83 79 Dax 55 30 228 92 95 79 90 65 60 Assume that the weights used to compute the final grades are homework 0.3, labs 0.2, the final 0.35, and the project 0.15. | Write an explicit formula to compute Avery's final grade using a single inner product. Write an explicit formula to compute everyone's final grade simultane- ously using a single matrix-vector product.arrow_forward1. Explicitly compute by hand (with work shown) the following Frobenius inner products 00 4.56 3.12 (a) ((º º º). (156 (b) 10.9 -1 0 2)), Fro 5')) Froarrow_forward
- 3. Let 4 0 0 00 0 0 1.2 0 00 0 0 0 -10.1 0 0 0 D = 0 0 0 00 0 0 0 0 05 0 0 0 0 0 0 2.8 Either explicitly compute D-¹ or explain why it doesn't exist.arrow_forward4. [9 points] Assume that B, C, E are all 3 x 3 matrices such that BC == -64 -1 0 3 4 4 4 -2 2 CB=-1-2 4 BE -2 1 3 EC = 1 3 2 -7, 1 6 -6 2-5 -7 -2 Explicitly compute the following by hand. (I.e., write out the entries of the 3 × 3 matrix.) (a) [3 points] B(E+C) (b) [3 points] (E+B)C (c) [3 points] ETBTarrow_forward6. Consider the matrices G = 0 (3) -3\ -3 2 and H = -1 2 0 5 0 5 5 noting that H(:, 3) = 2H(:,1) + H(:, 2). Is G invertible? Explain your answer. Is H invertible? Explain your answer. Use co-factor expansion to find the determinant of H. (Hint: expand the 2nd or 3rd row)arrow_forward
 Algebra and Trigonometry (6th Edition)AlgebraISBN:9780134463216Author:Robert F. BlitzerPublisher:PEARSON
 Contemporary Abstract AlgebraAlgebraISBN:9781305657960Author:Joseph GallianPublisher:Cengage Learning
 Linear Algebra: A Modern IntroductionAlgebraISBN:9781285463247Author:David PoolePublisher:Cengage Learning
 Algebra And Trigonometry (11th Edition)AlgebraISBN:9780135163078Author:Michael SullivanPublisher:PEARSON
 Introduction to Linear Algebra, Fifth EditionAlgebraISBN:9780980232776Author:Gilbert StrangPublisher:Wellesley-Cambridge Press
 College Algebra (Collegiate Math)AlgebraISBN:9780077836344Author:Julie Miller, Donna GerkenPublisher:McGraw-Hill Education