Concept explainers
Interpretation:
For anoverdamped system forced by a square wave given by
Concept Introduction:
Poincare map is defined by
Answer to Problem 3E
Solution:
a)
b)
c) The limits of
d) The Poincare map
e) Using a cobweb picture,
Explanation of Solution
a)
The given system equations are
Multiply the complete equation by
Integrate it with respect to
But,
Divide the complete equation by
Rearrange it as:
Let
Hence, it is proved.
b)
Suppose that the system has a T-periodic solution. Then,
But
Rearrange it as
Hence, it is proved.
c)
Similarly,
These results are plausible. Since as
As
And the solution becomes
d)
Since,
In a general form, it can be written as
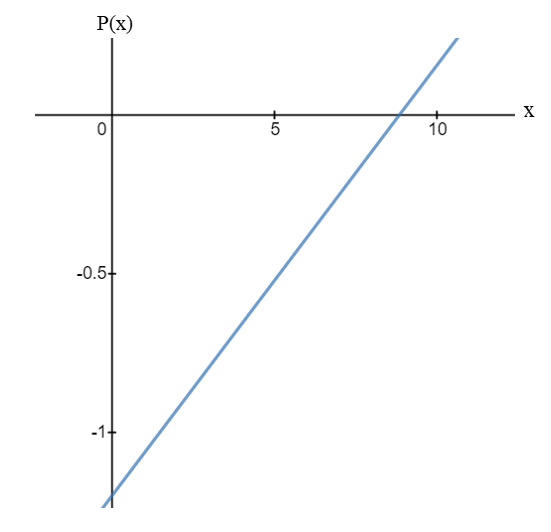
It is a straight line equation of the form
The plot of

e)
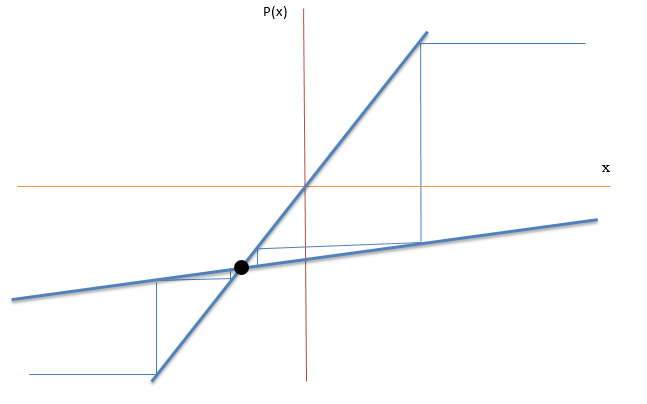
The cobweb plot of the given system at

Since
Want to see more full solutions like this?
Chapter 8 Solutions
Nonlinear Dynamics and Chaos
- Convert 101101₂ to base 10arrow_forwardDefinition: A topology on a set X is a collection T of subsets of X having the following properties. (1) Both the empty set and X itself are elements of T. (2) The union of an arbitrary collection of elements of T is an element of T. (3) The intersection of a finite number of elements of T is an element of T. A set X with a specified topology T is called a topological space. The subsets of X that are members of are called the open sets of the topological space.arrow_forward2) Prove that for all integers n > 1. dn 1 (2n)! 1 = dxn 1 - Ꮖ 4 n! (1-x)+/arrow_forward
- Definition: A topology on a set X is a collection T of subsets of X having the following properties. (1) Both the empty set and X itself are elements of T. (2) The union of an arbitrary collection of elements of T is an element of T. (3) The intersection of a finite number of elements of T is an element of T. A set X with a specified topology T is called a topological space. The subsets of X that are members of are called the open sets of the topological space.arrow_forwardDefinition: A topology on a set X is a collection T of subsets of X having the following properties. (1) Both the empty set and X itself are elements of T. (2) The union of an arbitrary collection of elements of T is an element of T. (3) The intersection of a finite number of elements of T is an element of T. A set X with a specified topology T is called a topological space. The subsets of X that are members of are called the open sets of the topological space.arrow_forward3) Let a1, a2, and a3 be arbitrary real numbers, and define an = 3an 13an-2 + An−3 for all integers n ≥ 4. Prove that an = 1 - - - - - 1 - - (n − 1)(n − 2)a3 − (n − 1)(n − 3)a2 + = (n − 2)(n − 3)aı for all integers n > 1.arrow_forward
- Definition: A topology on a set X is a collection T of subsets of X having the following properties. (1) Both the empty set and X itself are elements of T. (2) The union of an arbitrary collection of elements of T is an element of T. (3) The intersection of a finite number of elements of T is an element of T. A set X with a specified topology T is called a topological space. The subsets of X that are members of are called the open sets of the topological space.arrow_forwardDefinition: A topology on a set X is a collection T of subsets of X having the following properties. (1) Both the empty set and X itself are elements of T. (2) The union of an arbitrary collection of elements of T is an element of T. (3) The intersection of a finite number of elements of T is an element of T. A set X with a specified topology T is called a topological space. The subsets of X that are members of are called the open sets of the topological space.arrow_forwardDefinition: A topology on a set X is a collection T of subsets of X having the following properties. (1) Both the empty set and X itself are elements of T. (2) The union of an arbitrary collection of elements of T is an element of T. (3) The intersection of a finite number of elements of T is an element of T. A set X with a specified topology T is called a topological space. The subsets of X that are members of are called the open sets of the topological space.arrow_forward
- Algebra & Trigonometry with Analytic GeometryAlgebraISBN:9781133382119Author:SwokowskiPublisher:Cengage
