
Concept explainers
Videos
(a)
The equilibrium solutions based on the significance.
(a)
Answer to Problem 10E
The 5000 aphids are enough to support a constant ladybugs population of 200.
Explanation of Solution
Given information:
Populations of aphids and ladybugs are modelled by the equations,
Formula used:
Solving of the equation.
Calculation:
To find the equilibrium (constant) solution is of the system, solve the following equations.
Or
One solution of this system is given as,
This means that there are no aphids or ladybugs, the populations are certainly not going to increase.
The other equilibrium solution can be obtained by solve the following equations.
Or
And
This means that, 5000 aphids are enough to support a constant ladybugs population of 200.
Conclusion:
The 5000 aphids are enough to support a constant ladybugs population of 200.
(b)
To find: The value of
(b)
Answer to Problem 10E
The value is
Explanation of Solution
Given information:
Populations of aphids and ladybugs are modelled by the equations,
Formula used:
Calculation:
To find an expression for
Conclusion:
The value is
(c)
To explain:when there is a common phase trajectories.
(c)
Answer to Problem 10E
The phase trajectories have the point (5000, 200) in common
Explanation of Solution
Given information:
Populations of aphids and ladybugs are modelled by the equations,
Formula used:
Calculation:
To sketch the direction field for this differential equation, use Maple as follows.
Consider the dependent variable L as y and the independent variable A as x in this equation to use maple.
First install the packages,
Then use the following command to sketch the direction field.
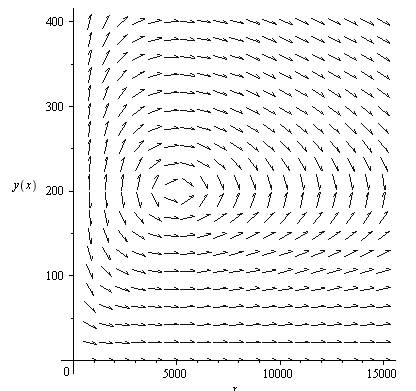
To sketch the phase portrait, use the following commands.
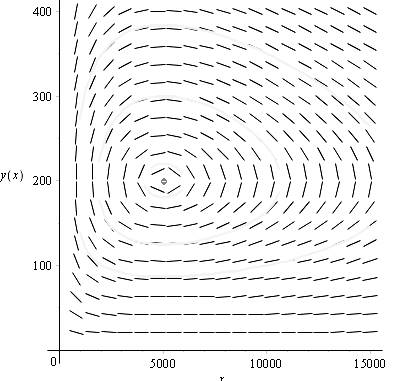
From the figure, we observe that, the phase trajectories have the point (5000, 200) in common.
Conclusion:
The phase trajectories have the point (5000, 200) in common
(d)
The phase trajectory of the aphids and ladybugs.
(d)
Answer to Problem 10E
It is not possible to describe the populations of aphids and ladybugs.
Explanation of Solution
Given information:
Populations of aphids and ladybugs are modelled by the equations,
Formula used:
Calculation:
Use the following command, to sketch the solution curve through the point (1000, 200)
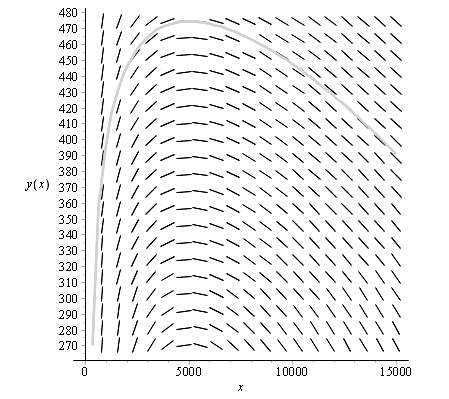
From the figure observe that, there is no solution curve exist passing through the point (1000, 200).
Hence, not possible to describe the populations of aphids and ladybugs.
Conclusion:
It is not possible to describe the populations of aphids and ladybugs.
(e)
The rough sketches of aphids and ladybugs.
(e)
Answer to Problem 10E
The rough sketches of both the populations separately cannot be drawn.
Explanation of Solution
Given information:
Populations of aphids and ladybugs are modelled by the equations,
Formula used:
Solving of the equation.
Calculation:
From the observation of the part ((1), we cannot make rough sketches of both the populations separately.
Conclusion:
The rough sketches of both the populations separately cannot be drawn.
Chapter 7 Solutions
Single Variable Calculus: Concepts and Contexts, Enhanced Edition


- Calculus lll May I please have the blank lines completed, and final statement defined as a result? Thank you for the support!arrow_forward3. Consider the polynomial equation 6-iz+7z² - iz³ +z = 0 for which the roots are 3i, -2i, -i, and i. (a) Verify the relations between this roots and the coefficients of the polynomial. (b) Find the annulus region in which the roots lie.arrow_forwardForce with 800 N and 400 N are acting on a machine part at 30° and 60°, respectively with the positive x axisarrow_forward
- Find the accumulated amount A, if the principal P is invested at an interest rate of r per year for t years. (Round your answer to the nearest cent.) P = $13,000, r = 6%, t = 10, compounded quarterly A = $ 31902 Need Help? Read It Watch It Viewing Saved Work Revert to Last Response SUBMIT ANSWER O/6.66 Points] DETAILS MY NOTES TANAPCALC10 5.3.003. EVIOUS ANSWERS ASK YOUR TEACHER PRACTICE ANOTHER Find the accumulated amount A, if the principal P is invested at an interest rate of r per year for t years. (Round your answer to the nearest cent.) P = $140,000, r = 8%, t = 8, compounded monthly A = $259130.20 X Need Help? Read It Watch Itarrow_forwardFind the present value of $20,000 due in 3 years at the given rate of interest. (Round your answers to the nearest cent.) (a) 2%/year compounded monthly (b) 5%/year compounded daily $ Need Help? Read It Watch It SUBMIT ANSWER [-/6.66 Points] DETAILS MY NOTES TANAPCALC10 5.3.009. ASK YOUR TEACHER PRACTICE ANC Find the accumulated amount after 3 years if $4000 is invested at 3%/year compounded continuously. (Round your answer to the nearest cent.) Need Help? Read It Watch Itarrow_forwardFind the effective rate corresponding to the given nominal rate. (Round your answers to three decimal places.) (a) 9.5%/year compounded monthly % (b) 9.5%/year compounded daily % Need Help? Read It Watch It SUBMIT ANSWER -/6.66 Points] DETAILS MY NOTES TANAPCALC10 5.3.007. ASK YOUR TEACHE Find the present value of $90,000 due in 7 years at the given rate of interest. (Round your answers to the nearest cent.) (a) 9%/year compounded semiannually (b) 9%/year compounded quarterly LAarrow_forward
- Find the accumulated amount A, if the principal P is invested at an interest rate of r per year for t years. (Round your answer to the nearest cent.) P = $160,000, r = 7%, t = 4, compounded daily A = $211113.60 Need Help? Read It SUBMIT ANSWER ASK YOUR TEACHER PRACTICE ANOTHER --/6.66 Points] DETAILS MY NOTES TANAPCALC10 5.3.005. Find the effective rate corresponding to the given nominal rate. (Round your answers to three decimal places.) (a) 8%/year compounded semiannually % (b) 9%/year compounded quarterly %arrow_forwardFind the derivative of the function. g'(t) = 9t g(t) = In(t) (9ln(t) - 1) [In(t)] 2 × Need Help? Read It Watch Itarrow_forwardFind the accumulated amount A, if the principal P is invested at an interest rate of r per year for t years. (Round your answer to the nearest cent.) P = $3800, r = 4%, t = 10, compounded semiannually A = $ 5645.60 × Need Help? Read It SUBMIT ANSWER [3.33/6.66 Points] DETAILS MY NOTES REVIOUS ANSWERS ASK YOUR TEACHER TANAPCALC10 5.3.001.EP. PRACTICE ANOTHER Consider the following where the principal P is invested at an interest rate of r per year for t years. P = $3,100, r = 4%, t = 10, compounded semiannually Determine m, the number of conversion periods per year. 2 Find the accumulated amount A (in dollars). (Round your answer to the nearest cent.) A = $ 4604.44arrow_forward
- Force with 800 N and 400 N are acting on a machine part at 30° and 60°, respectively with a positive x axis, Draw the diagram representing this situationarrow_forwardI forgot to mention to you to solve question 1 and 2. Can you solve it using all data that given in the pict i given and can you teach me about that.arrow_forwardexam review please help!arrow_forward
 Calculus: Early TranscendentalsCalculusISBN:9781285741550Author:James StewartPublisher:Cengage Learning
 Thomas' Calculus (14th Edition)CalculusISBN:9780134438986Author:Joel R. Hass, Christopher E. Heil, Maurice D. WeirPublisher:PEARSON
 Calculus: Early Transcendentals (3rd Edition)CalculusISBN:9780134763644Author:William L. Briggs, Lyle Cochran, Bernard Gillett, Eric SchulzPublisher:PEARSON
 Calculus: Early TranscendentalsCalculusISBN:9781319050740Author:Jon Rogawski, Colin Adams, Robert FranzosaPublisher:W. H. Freeman
 Calculus: Early Transcendental FunctionsCalculusISBN:9781337552516Author:Ron Larson, Bruce H. EdwardsPublisher:Cengage Learning