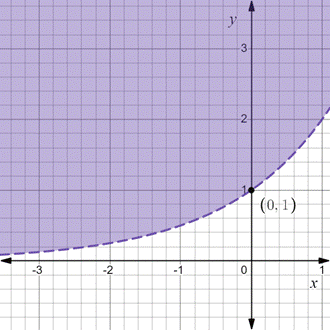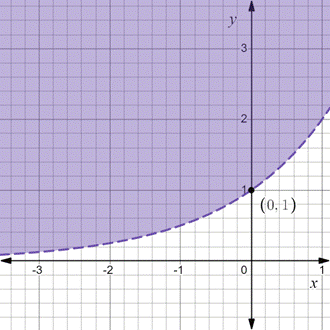
To Graph: The given inequality by using the hand sketch and state the boundary region.
The boundary

Given Information:
The inequality is defined as,
Explanation:
Consider the given inequality,
Replacing the inequality symbol with the = symbol, the equation for the boundary is
Now, find the intercept of the line. Substitute 0 for x and then 0 for y in the line one by one.
And,
Therefore, the intercept are
The boundary point is included if the inequality containing
As the greater then symbol was used, then the boundary is not included in the graph and drawing it by using dotted line. To determine the half-plane to be shaded, use a test point not on the boundary, say
The statement is not true so the shade the half-plane where

Hence, the required graph is shown above and the boundary
Chapter 7 Solutions
PRECALCULUS:GRAPHICAL,...-NASTA ED.
- The function f is given by f(x) = cos(x + 1). The solutions to which 6 of the following equations on the interval 0≤ x ≤ 2 are the solutions to f(x) = 1½ on the interval 0 < x < 2π? 2 A √√3 cos x - sin x = 1 B √√3 cos x + sin x = 1 C √3 sin x COS x = 1 D √√3 sin x + cos x = 1arrow_forwardSuppose that the graph below is the graph of f'(x), the derivative of f(x). Find the locations of all relative extrema, and tell whether each extremum is a relative maximum or minimum. Af'(x) Select the correct choice below and fill in the answer box(es) within your choice. (Simplify your answer. Use a comma to separate answers as needed.) -10 86-4-2 -9- B 10 X G A. The function f(x) has a relative maximum at x= relative minimum at x = and a B. The function f(x) has a relative maximum at x= no relative minimum. and has C. There is not enough information given. D. The function f(x) has a relative minimum at x= no relative maximum. and has E. The function f(x) has no relative extrema.arrow_forwardK Find the x-values of all points where the function has any relative extrema. Find the value(s) of any relative extrema. f(x) = 12x+13x 12/13 Select the correct choice below and, if necessary, fill in any answer boxes within your choice. OA. There are no relative maxima. The function has a relative minimum of (Use a comma to separate answers as needed.) OB. There are no relative minima. The function has a relative maximum of (Use a comma to separate answers as needed.) OC. The function has a relative maximum of at x= (Use a comma to separate answers as needed.) OD. There are no relative extrema. at x= at x= and a relative minimum of at x=arrow_forward
- K Find the x-values of all points where the function has any relative extrema. Find the value(s) of any relative extrema. f(x) = - 2 3 9 -4x+17 Select the correct choice below and, if necessary, fill in any answer boxes within your choice. OA. There are no relative minima. The function has a relative maximum of (Use a comma to separate answers as needed.) OB. There are no relative maxima. The function has a relative minimum of (Use a comma to separate answers as needed.) OC. The function has a relative maximum of at x= (Use a comma to separate answers as needed.) OD. There are no relative extrema. at x= at x= and a relative minimum of at x=arrow_forwardK Find the x-values of all points where the function defined as follows has any relative extrema. Find the values of any relative extrema. f(x)=5x+ In x Select the correct choice below and, if necessary, fill in the answer boxes to complete your choices. OA. There is a relative minimum of OB. There is a relative maximum of OC. There is a relative minimum of OD. There are no relative extrema. at x= at x= at x= There is a relative maximum of at x=arrow_forward21-100 Spring 2024 Fin gra 10 8 Ay -10 -B -2 -4- -6 -8- -10- 10 re xamp OK CH acer USarrow_forward
- The total profit P(X) (in thousands of dollars) from a sale of x thousand units of a new product is given by P(x) = In (-x+6x² + 63x+1) (0≤x≤10). a) Find the number of units that should be sold in order to maximize the total profit. b) What is the maximum profit? a) The number of units that should be sold in order to maximize the total profit is ☐ (Simplify your answer.)arrow_forwardFind the x-values of all points where the function has any relative extrema. Find the value(s) of any relative extrema. f(x) = -x3+3x² +24x-4 Select the correct choice below and, if necessary, fill in any answer boxes within your choice. OA. There are no relative maxima. The function has a relative minimum of at x= (Use a comma to separate answers as needed.) OB. The function has relative minimum of at x= and a relative maximum of at x= (Use a comma to separate answers as needed.) OC. There are no relative minima. The function has a relative maximum of (Use a comma to separate answers as needed.) OD. There are no relative extrema. at x=arrow_forwardcan you solve this question step by step with detail explaination pleasearrow_forward
- can you solve this question step by step with detail explaination pleasearrow_forwardCalculus lll May I please have the all properties of the dot product? Thank youarrow_forwardFind the tangent line approximation 7 to the graph of f at the given point. T(x) = f(x) = csc(x), (8, csc(8)) Complete the table. (Round your answers to four decimal places.) x f(x) T(x) 7.9 7.99 8 8.01 8.1arrow_forward
 Calculus: Early TranscendentalsCalculusISBN:9781285741550Author:James StewartPublisher:Cengage Learning
 Thomas' Calculus (14th Edition)CalculusISBN:9780134438986Author:Joel R. Hass, Christopher E. Heil, Maurice D. WeirPublisher:PEARSON
 Calculus: Early Transcendentals (3rd Edition)CalculusISBN:9780134763644Author:William L. Briggs, Lyle Cochran, Bernard Gillett, Eric SchulzPublisher:PEARSON
 Calculus: Early TranscendentalsCalculusISBN:9781319050740Author:Jon Rogawski, Colin Adams, Robert FranzosaPublisher:W. H. Freeman
 Calculus: Early Transcendental FunctionsCalculusISBN:9781337552516Author:Ron Larson, Bruce H. EdwardsPublisher:Cengage Learning


