To graph: The given inequality
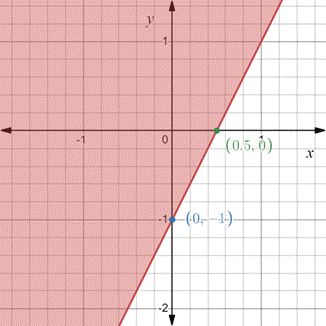
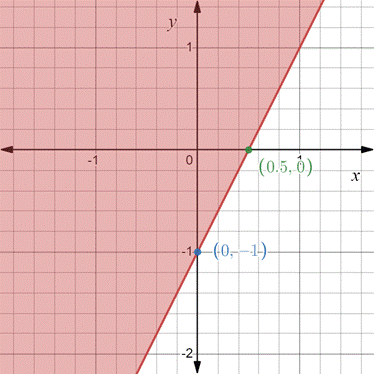
The required graph is show as following,

Given Information:
The inequality is defined as,
Explanation:
Consider the given inequality,
The boundary is included if
So, the boundaries are included.
Replacing the inequality symbol with the
Now, find the intercepts of the equation by substituting 0 for x and 0 for y one by one.
And,
Therefore, the intercept is
To determine the half-plane to be shaded, use a test point not on the boundary, say
The statement is true so shade the half-plane where
Draw the given inequality.

Hence, the above graph is the required graph.
Chapter 7 Solutions
PRECALCULUS:GRAPHICAL,...-NASTA ED.
 Calculus: Early TranscendentalsCalculusISBN:9781285741550Author:James StewartPublisher:Cengage Learning
 Thomas' Calculus (14th Edition)CalculusISBN:9780134438986Author:Joel R. Hass, Christopher E. Heil, Maurice D. WeirPublisher:PEARSON
 Calculus: Early Transcendentals (3rd Edition)CalculusISBN:9780134763644Author:William L. Briggs, Lyle Cochran, Bernard Gillett, Eric SchulzPublisher:PEARSON
 Calculus: Early TranscendentalsCalculusISBN:9781319050740Author:Jon Rogawski, Colin Adams, Robert FranzosaPublisher:W. H. Freeman
 Calculus: Early Transcendental FunctionsCalculusISBN:9781337552516Author:Ron Larson, Bruce H. EdwardsPublisher:Cengage Learning


