
Concept explainers
Videos
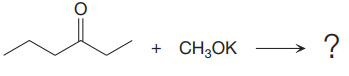
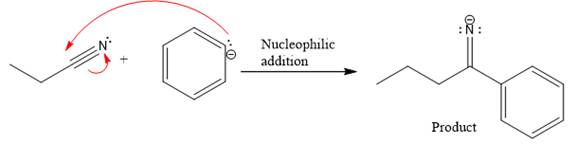
(a)
Interpretation:
Curved arrow and the product formed for the given nucleophilic addition step are to be drawn.
Concept introduction:
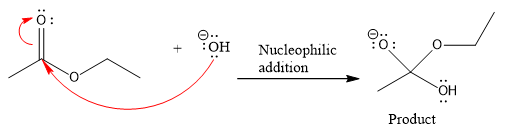
The curved arrow drawn from the nucleophile (electron rich species) to the polar pi-bond (electron poor species) represents the flow of electrons from an electron rich site to an electron poor site. The second curved arrow is drawn from the center of double or triple bond to the electronegative atom. A new bond is formed between the nucleophile and the electron deficient atom.
Answer to Problem 7.26P
The curved arrow and the product formed in the given nucleophilic addition step is drawn as:

Explanation of Solution
In the given nucleophilic addition step is:
In this step,
Thus, the curved arrows for the given nucleophilic addition step are drawn as:
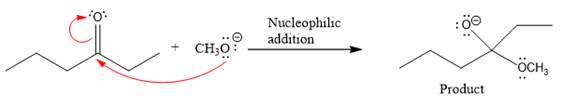
The new bond in the product is formed between the electron rich O atom from the nucleophile and the electron poor C atom of the carbonyl group.
The curved arrow represents the flow of electrons from an electron rich site to an electron poor site.
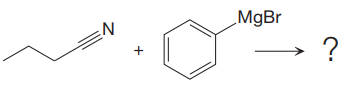
(b)
Interpretation:
Curved arrow and the product formed for the given nucleophilic addition step are to be drawn.
Concept introduction:
The curved arrow drawn from the nucleophile (electron rich species) to the polar pi-bond (electron poor species) represents the flow of electrons from an electron rich site to an electron poor site. The second curved arrow is drawn from the center of double or triple bond to the electronegative atom. A new bond is formed between the nucleophile and the electron deficient atom.
Answer to Problem 7.26P
The curved arrow and the product formed in the given nucleophilic addition step is drawn as:
Explanation of Solution
In the given nucleophilic addition step is:
In this step
Thus, the curved arrows for the given nucleophilic addition step are drawn as:
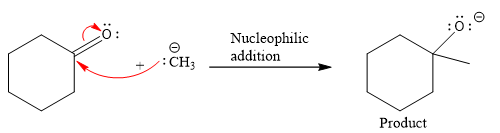
The new bond in the product is formed between electron rich C atom from the nucleophile and electron poor C atom of the carbonyl group.
The curved arrow represents the flow of electrons from electron rich site to electron poor site.
(c)
Interpretation:
Curved arrow and the product formed for the given nucleophilic addition step are to be drawn.
Concept introduction:
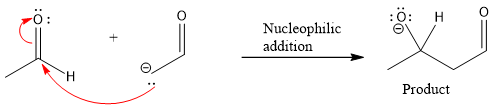
The curved arrow drawn from the nucleophile (electron rich species) to the polar pi-bond (electron poor species) represents the flow of electron from an electron rich site to an electron poor site. The second curved arrow is drawn from the center of double or triple bond to the electronegative atom. A new bond is formed between the nucleophile and the electron deficient atom.
Answer to Problem 7.26P
The curved arrow and the product formed in the given nucleophilic addition step is drawn as:
Explanation of Solution
In the given nucleophilic addition step is:
In this step
Thus, the curved arrows for the given nucleophilic addition step are drawn as:
The new bond in the product is formed between electron rich C atom from the nucleophile and electron poor C atom.
Curved arrow represents the flow of electrons from electron rich site to electron poor site.
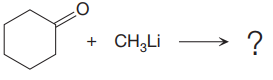
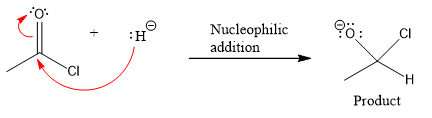
(d)
Interpretation:
Curved arrow and the product formed for given nucleophilic addition step are to be drawn.
Concept introduction:
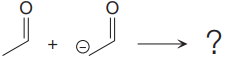
The curved arrow drawn from the nucleophile (electron rich species) to the polar pi-bond (electron poor species) represents the flow of electron from an electron rich site to an electron poor site. The second curved arrow is drawn from the centre of double or triple bond to the electronegative atom. A new bond is formed between the nucleophile and the electron deficient atom.
Answer to Problem 7.26P
The curved arrow and the product formed in the given nucleophilic addition step is drawn as:
Explanation of Solution
In the given nucleophilic addition step is:
In this step
Thus, the curved arrows for the given nucleophilic addition step are drawn as:
The new bond in the product is formed between the electron rich H atom from the nucleophile and the electron poor C atom of the carbonyl group.
Curved arrow represents flow of electrons from electron rich site to electron poor site.
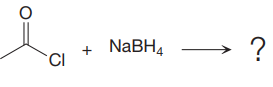
(e)
Interpretation:
Curved arrow and the product formed for given nucleophilic addition step are to be drawn.
Concept introduction:
The curved arrow drawn from the nucleophile (electron rich species) to the polar pi-bond (electron poor species) represents the flow of electron from an electron rich site to an electron poor site. The second curved arrow is drawn from the center of double or triple bond to the electronegative atom. A new bond is formed between the nucleophile and the electron deficient atom.
Answer to Problem 7.26P
The curved arrow and the product formed in the given nucleophilic addition step is drawn as:
Explanation of Solution
In the given nucleophilic addition step is:
In this step
Thus, the curved arrows for the given nucleophilic addition step are drawn as:
The new bond in the product is formed between electron rich O atom from the nucleophile and electron poor C atom of the carbonyl group.
Curved arrow represents the flow of electrons from electron rich site to electron poor site.
(f)
Interpretation:
Curved arrow and the product formed for the given nucleophilic addition step are to be drawn.
Concept introduction:
The curved arrow drawn from the nucleophile (electron rich species) to the polar pi-bond (electron poor species) represents the flow of electron from an electron rich site to an electron poor site. The second curved arrow is drawn from the center of double or triple bond to the electronegative atom. A new bond is formed between the nucleophile and the electron deficient atom.
Answer to Problem 7.26P
The curved arrow and the product formed in the given nucleophilic addition step is drawn as:
Explanation of Solution
In the given nucleophilic addition step is:
In the above step,
Thus, the curved arrows for the given nucleophilic addition step are drawn as:
The new bond in the product is formed between the electron rich C atom from the nucleophile and the electron poor C atom of the carbonyl group.
Curved arrow represents the flow of electrons from electron rich site to electron poor site.
Want to see more full solutions like this?
Chapter 7 Solutions
ORG CHEM W/ EBOOK & SW5 + STUDY GUIDE


- H I T H HH H -H C. H- Identify and select all structures below that represent a constitutional isomer(s) of the compound shown above. H- H CIH H H H HHHH H H 0 ·H H– 冊 CH CHI HH C- H- H H- H H A. H H C H H- -H HH H B. H- -H D. H H H H • H -H E. -H H H HICH T HHH F. H-arrow_forwardPolylactic acid (shown below) is a biodegradable polymer used for food packaging. Identify the monomer(s) used in the production of this polymer using a condensation process.arrow_forwardDraw the product of the reaction shown below. Ignore small byproducts that would evaporate pleasearrow_forward
- Poly(ethylene adipate) is a biodegradable polyester (shown below). Identify the type of polymerization process used in the production of this polymer.arrow_forwardPolymers may be composed of thousands of monomers. draw two repeat units(dimer) of the polymer formed in this reaction. assume there are hydrogen atoms on the two ends of the dimer. ignore inorganic byproducts pleasearrow_forwardDraw the product of the reaction shown below. Use a dash or wedge bond to indicate stereochemistry of substituents on asymmetric centers, Ignore inorganic byproductsarrow_forward
- Draw the product of this reaction please. Ignore inorganic byproductsarrow_forwardOne of the pi molecular orbitals of 1,3-butadiene (CH2=CHCH=CH2) is shown below. Please identify the number of nodal planes perpendicular to the bonding axisarrow_forwardDraw the monomers required to synthesize this condensation polymer please.arrow_forward
- Provide the correct systematic name for the compound shown here. Please take into account the keyboard options belowarrow_forwardcurved arrows are used to illustrate the flow of electrons. using the provided starting and product structures, draw the curved electron-pushing arrows for the following reaction or mechanistic step(s)arrow_forwardIdentify the 'cartoon' drawing of the acceptor orbital in the first mechanistic step of an electrophilic addition reaction of butadiene with HBr. Pleasearrow_forward
 Organic Chemistry: A Guided InquiryChemistryISBN:9780618974122Author:Andrei StraumanisPublisher:Cengage Learning