To analyze: The graph given by the polar equation
The graph is a circle. The range of the graph is
Given information:
The given polar equation is
Explanation:
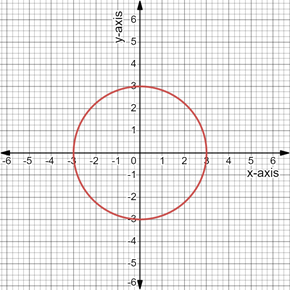
Plot the graph for the polar equation.

Figure (1)
From the figure (1), it can be observed that it is a circle.
The equation is defined for all real numbers of
The maximum value of
The graph is continuous.
The graph is symmetric about the both the axes and the origin.
Since
There are no asymptotes to the graph.
Therefore, the polar equation
Chapter 6 Solutions
PRECALCULUS:GRAPHICAL,...-NASTA ED.
 Calculus: Early TranscendentalsCalculusISBN:9781285741550Author:James StewartPublisher:Cengage Learning
 Thomas' Calculus (14th Edition)CalculusISBN:9780134438986Author:Joel R. Hass, Christopher E. Heil, Maurice D. WeirPublisher:PEARSON
 Calculus: Early Transcendentals (3rd Edition)CalculusISBN:9780134763644Author:William L. Briggs, Lyle Cochran, Bernard Gillett, Eric SchulzPublisher:PEARSON
 Calculus: Early TranscendentalsCalculusISBN:9781319050740Author:Jon Rogawski, Colin Adams, Robert FranzosaPublisher:W. H. Freeman
 Calculus: Early Transcendental FunctionsCalculusISBN:9781337552516Author:Ron Larson, Bruce H. EdwardsPublisher:Cengage Learning


