Concept explainers
To show:equation of best fit line and represent it by graph .
Answer to Problem 42MR
Explanation of Solution
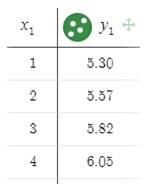
Given information:The data of the given linear modelin terms of year and price is represented in the table.
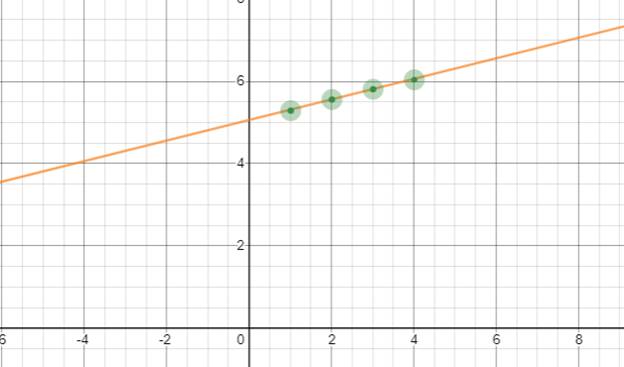
Graph:Assuming year to be


Interpretation :
Line of best fit is a straight line that is represented on
A line of best fit is usually found through simple linear regression that is by r-squared value which represents that if the value of r is nearer to 1 then it is a best fit line.
The equation of best fit line is shown in the above graph and let its equationis supposed to be as
Where ,
Therefore on simplifying the value we get
Hence the required equation is
Chapter 5 Solutions
High School Math 2015 Common Core Algebra 1 Student Edition Grade 8/9
Additional Math Textbook Solutions
Elementary Statistics
College Algebra (7th Edition)
Elementary Statistics: Picturing the World (7th Edition)
Algebra and Trigonometry (6th Edition)
Elementary Statistics (13th Edition)
- (±³d-12) (−7+ d) = |||- \d+84arrow_forward(z- = (-2) (→ Use the FOIL Method to find (z — · -arrow_forwardMODELING REAL LIFE Your checking account has a constant balance of $500. Let the function $m$ represent the balance of your savings account after $t$ years. The table shows the total balance of the accounts over time. Year, $t$ Total balance 0 1 2 3 4 5 $2500 $2540 $2580.80 $2622.42 $2664.86 $2708.16 a. Write a function $B$ that represents the total balance after $t$ years. Round values to the nearest hundredth, if necessary. $B\left(t\right)=$ Question 2 b. Find $B\left(8\right)$ . About $ a Question 3 Interpret $B\left(8\right)$ . b represents the total balance checking and saving accounts after 8 years the balance would be 16 / 10000 Word Limit16 words written of 10000 allowed Question 4 c. Compare the savings account to the account, You deposit $9000 in a savings account that earns 3.6% annual interest compounded monthly. A = 11998.70 SINCE 9000 is the principal ( 1+0.036/12)12 times 8 gives me aproxtimately 1997 14 / 10000 Word Limit14 words written of 10000 allowed Skip to…arrow_forward
- Listen MODELING REAL LIFE Your checking account has a constant balance of $500. Let the function m represent the balance of your savings account after t years. The table shows the total balance of the accounts over time. Year, t Total balance 0 $2500 1 $2540 2 $2580.80 3 $2622.42 4 $2664.86 5 $2708.16 a. Write a function B that represents the total balance after t years. Round values to the nearest hundredth, if necessary. B(t) = 500 + 2000(1.02)* b. Find B(8). About $2843.32 Interpret B(8). B I U E T² T₂ c. Compare the savings account to the account, You deposit $9000 in a savings account that earns 3.6% annual interest compounded monthly. B I U E E T² T₂ A = 11998.70 SINCE 9000 is the principal (1+0.036/12)12 times 8 gives me aproxtimately 1997arrow_forwardWhat are the answers for star powerarrow_forwardThe recciprocal rulearrow_forward
- This is an example only. What can be a simialr equation with differnet numbers using logs and can have a mistake in one of the steps and what will be the correct way to solve it. Thanksarrow_forwardCan we have an exponential equation using logarithm however i want to show that one mistake is involved in solving it. Showing the mistake and how to be fixed. Thanks.arrow_forwardIs it possible to show me how to come up with an exponential equation by showing all the steps work and including at least one mistake that me as a person can make. Like a calculation mistake and high light what the mistake is. Thanks so much.arrow_forward
- Consider the weighted voting system [16: 15, 8, 3, 1]Find the Banzhaf power distribution of this weighted voting system.List the power for each player as a fraction: P1: P2: P3: P4:arrow_forwardSolutions of inequalitie Google Classroom Mic Is (-3, 2) a solution of 7x+9y > -3? Choose 1 answer: A Yes B No Related content ▶6:06 Testing solutions to inequalities 2 of 4arrow_forwardAre natural logarithms used in real life ? How ? Can u give me two or three ways we can use them. Thanksarrow_forward
 Algebra and Trigonometry (6th Edition)AlgebraISBN:9780134463216Author:Robert F. BlitzerPublisher:PEARSON
 Contemporary Abstract AlgebraAlgebraISBN:9781305657960Author:Joseph GallianPublisher:Cengage Learning
 Linear Algebra: A Modern IntroductionAlgebraISBN:9781285463247Author:David PoolePublisher:Cengage Learning
 Algebra And Trigonometry (11th Edition)AlgebraISBN:9780135163078Author:Michael SullivanPublisher:PEARSON
 Introduction to Linear Algebra, Fifth EditionAlgebraISBN:9780980232776Author:Gilbert StrangPublisher:Wellesley-Cambridge Press
 College Algebra (Collegiate Math)AlgebraISBN:9780077836344Author:Julie Miller, Donna GerkenPublisher:McGraw-Hill Education


