
Concept explainers
Videos
To graph: the
Answer to Problem 9PPE
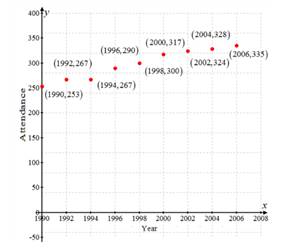
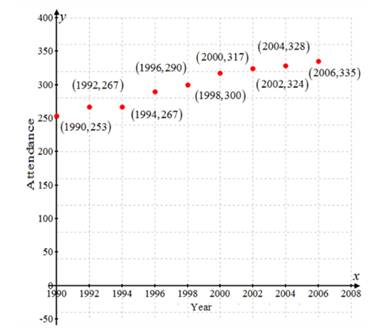
The scatter plot:
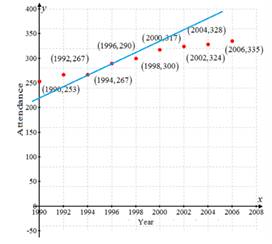
The trend line:
The attendance at U.S. theme park in the year 2005 is
Explanation of Solution
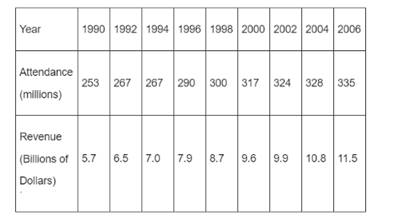
Given information:
Consider the following table for the attendance and revenue at U.S:
Calculation:
Make a scatter plot of the data
Treat the data as ordered pairs
For the year of 1990 and the attendance of 253, plot (1990, 253) and so on.
Make a scatter plot and draw a trend line.

Estimate the coordinates of two points on the line.
Suppose take any two points on trend line that is (4,267) and (6,290).
Write an equation of the trend line.
First find the slope of the trend line.
Use slope intercept form,
Substitute 11.5 for
Therefore, the equation of the best line is
To estimate the attendance at U.S. theme park in 2005.
Substitute 15 for
Therefore, the attendance at U.S. theme park in the year 2005 is
Chapter 5 Solutions
High School Math 2015 Common Core Algebra 1 Student Edition Grade 8/9
Additional Math Textbook Solutions
A First Course in Probability (10th Edition)
Calculus: Early Transcendentals (2nd Edition)
Elementary Statistics
Elementary Statistics: Picturing the World (7th Edition)
Pre-Algebra Student Edition
Basic Business Statistics, Student Value Edition


- Find the Laplace Transform of the function to express it in frequency domain form.arrow_forwardPlease draw a graph that represents the system of equations f(x) = x2 + 2x + 2 and g(x) = –x2 + 2x + 4?arrow_forwardGiven the following system of equations and its graph below, what can be determined about the slopes and y-intercepts of the system of equations? 7 y 6 5 4 3 2 -6-5-4-3-2-1 1+ -2 1 2 3 4 5 6 x + 2y = 8 2x + 4y = 12 The slopes are different, and the y-intercepts are different. The slopes are different, and the y-intercepts are the same. The slopes are the same, and the y-intercepts are different. O The slopes are the same, and the y-intercepts are the same.arrow_forward
- Choose the function to match the graph. -2- 0 -7 -8 -9 --10- |--11- -12- f(x) = log x + 5 f(x) = log x - 5 f(x) = log (x+5) f(x) = log (x-5) 9 10 11 12 13 14arrow_forwardWhich of the following represents the graph of f(x)=3x-2? 7 6 5 4 ++ + + -7-6-5-4-3-2-1 1 2 3 4 5 6 7 -2 3 -5 6 -7 96 7 5 4 O++ -7-6-5-4-3-2-1 -2 -3 -4 -5 -7 765 432 -7-6-5-4-3-2-1 -2 ++ -3 -4 -5 -6 2 3 4 5 6 7 7 6 2 345 67 -7-6-5-4-3-2-1 2 3 4 5 67 4 -5arrow_forward13) Let U = {j, k, l, m, n, o, p} be the universal set. Let V = {m, o,p), W = {l,o, k}, and X = {j,k). List the elements of the following sets and the cardinal number of each set. a) W° and n(W) b) (VUW) and n((V U W)') c) VUWUX and n(V U W UX) d) vnWnX and n(V WnX)arrow_forward
- 9) Use the Venn Diagram given below to determine the number elements in each of the following sets. a) n(A). b) n(A° UBC). U B oh a k gy ท W z r e t ་ Carrow_forward10) Find n(K) given that n(T) = 7,n(KT) = 5,n(KUT) = 13.arrow_forward7) Use the Venn Diagram below to determine the sets A, B, and U. A = B = U = Blue Orange white Yellow Black Pink Purple green Grey brown Uarrow_forward
 Algebra and Trigonometry (6th Edition)AlgebraISBN:9780134463216Author:Robert F. BlitzerPublisher:PEARSON
 Contemporary Abstract AlgebraAlgebraISBN:9781305657960Author:Joseph GallianPublisher:Cengage Learning
 Linear Algebra: A Modern IntroductionAlgebraISBN:9781285463247Author:David PoolePublisher:Cengage Learning
 Algebra And Trigonometry (11th Edition)AlgebraISBN:9780135163078Author:Michael SullivanPublisher:PEARSON
 Introduction to Linear Algebra, Fifth EditionAlgebraISBN:9780980232776Author:Gilbert StrangPublisher:Wellesley-Cambridge Press
 College Algebra (Collegiate Math)AlgebraISBN:9780077836344Author:Julie Miller, Donna GerkenPublisher:McGraw-Hill Education