
Concept explainers
Videos
To explain: the characteristics of a graph that represents the rate of change.
Explanation of Solution
Formula used: The slope between the points
In the above formula
The following graph shows the rise and run of the graph.
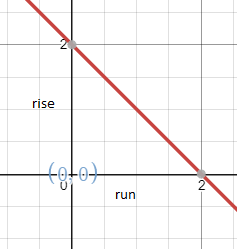
The Rise of the graph shows the number of units the point moves up or down. The Run means the number of points the point moves left or right.
Therefore, the slope of the graph is calculated by the ratio of rise of graph to the run of thegraph. This slope depicts the rate of change.
Chapter 5 Solutions
High School Math 2015 Common Core Algebra 1 Student Edition Grade 8/9
Additional Math Textbook Solutions
Elementary Statistics: Picturing the World (7th Edition)
College Algebra (7th Edition)
Elementary Statistics
Algebra and Trigonometry (6th Edition)


- Please draw a graph that represents the system of equations f(x) = x2 + 2x + 2 and g(x) = –x2 + 2x + 4?arrow_forwardGiven the following system of equations and its graph below, what can be determined about the slopes and y-intercepts of the system of equations? 7 y 6 5 4 3 2 -6-5-4-3-2-1 1+ -2 1 2 3 4 5 6 x + 2y = 8 2x + 4y = 12 The slopes are different, and the y-intercepts are different. The slopes are different, and the y-intercepts are the same. The slopes are the same, and the y-intercepts are different. O The slopes are the same, and the y-intercepts are the same.arrow_forwardChoose the function to match the graph. -2- 0 -7 -8 -9 --10- |--11- -12- f(x) = log x + 5 f(x) = log x - 5 f(x) = log (x+5) f(x) = log (x-5) 9 10 11 12 13 14arrow_forward
- Which of the following represents the graph of f(x)=3x-2? 7 6 5 4 ++ + + -7-6-5-4-3-2-1 1 2 3 4 5 6 7 -2 3 -5 6 -7 96 7 5 4 O++ -7-6-5-4-3-2-1 -2 -3 -4 -5 -7 765 432 -7-6-5-4-3-2-1 -2 ++ -3 -4 -5 -6 2 3 4 5 6 7 7 6 2 345 67 -7-6-5-4-3-2-1 2 3 4 5 67 4 -5arrow_forward13) Let U = {j, k, l, m, n, o, p} be the universal set. Let V = {m, o,p), W = {l,o, k}, and X = {j,k). List the elements of the following sets and the cardinal number of each set. a) W° and n(W) b) (VUW) and n((V U W)') c) VUWUX and n(V U W UX) d) vnWnX and n(V WnX)arrow_forward9) Use the Venn Diagram given below to determine the number elements in each of the following sets. a) n(A). b) n(A° UBC). U B oh a k gy ท W z r e t ་ Carrow_forward
- 5) Describe the difference between disjoint sets and overlapping sets.arrow_forward12) Suppose U = {a,b,c,d,e) and A = {a, b, c, e) and B = (c,d,e). Determine (An B).arrow_forward1) Use the roster method to list the elements of the set consisting of: a) All positive multiples of 3 that are less than 20. b) Nothing (An empty set).arrow_forward
 Algebra and Trigonometry (6th Edition)AlgebraISBN:9780134463216Author:Robert F. BlitzerPublisher:PEARSON
 Contemporary Abstract AlgebraAlgebraISBN:9781305657960Author:Joseph GallianPublisher:Cengage Learning
 Linear Algebra: A Modern IntroductionAlgebraISBN:9781285463247Author:David PoolePublisher:Cengage Learning
 Algebra And Trigonometry (11th Edition)AlgebraISBN:9780135163078Author:Michael SullivanPublisher:PEARSON
 Introduction to Linear Algebra, Fifth EditionAlgebraISBN:9780980232776Author:Gilbert StrangPublisher:Wellesley-Cambridge Press
 College Algebra (Collegiate Math)AlgebraISBN:9780077836344Author:Julie Miller, Donna GerkenPublisher:McGraw-Hill Education