
Videos
(a)
To Find: The graphing utility to create the
(a)
Answer to Problem 93E
The required plot is shown in Figure 1
Explanation of Solution
Given:
The given table is shown in Table 1
Table 1
| Month | Chicago, C |
| 1 | 31.0 |
| 2 | 35.3 |
| 3 | 46.6 |
| 4 | 59.0 |
| 5 | 70.0 |
| 6 | 79.7 |
| 7 | 84.1 |
| 8 | 81.9 |
| 9 | 74.8 |
| 10 | 62.3 |
| 11 | 48.2 |
| 12 | 34.8 |
Calculation:
From the given table the model for the scatter plot is shown in Figure 1

Figure 1
(b)
To Find: The cosine model for the temperature.
(b)
Answer to Problem 93E
The required model is
Explanation of Solution
The general form for the cosine model is of the form,
Then, the amplitude of the model is,
The cosine function complete one half of the cycle between the times at which the temperature occur then, the period is,
Then, the value of
The value of d is obtained as,
Thus, the required equation for the model is,
(c)
To Find: The graph for the model and the scatter plot in the same viewing window and determine how well the model does fit the data.
(c)
Answer to Problem 93E
The graph is shown in Figure 2 and the model fits the graph very well.
Explanation of Solution
From the given table the model for the scatter plot is shown in Figure 2
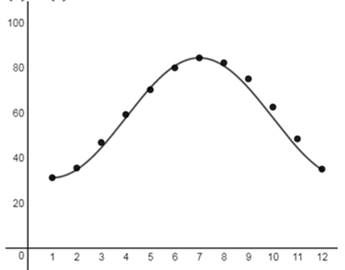
Figure 2
The model
(d)
To Find: The overall normal daily high temperature.
(d)
Answer to Problem 93E
The overall daily high temperature is the average given by
Explanation of Solution
The overall daily high temperature is the average given by
(e)
To Find: The months during which the normal high temperature is above
(e)
Answer to Problem 93E
The temperature above
Explanation of Solution
The overall daily high temperature is the average given by
Consider the graph shown in Figure 3
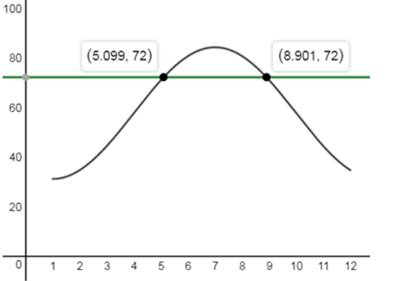
Figure 3
The month in which the temperature is above
The month in which the temperature is below
Chapter 5 Solutions
EBK PRECALCULUS W/LIMITS


- Two cables tied together at C are loaded as shown. Given: Q = 130 lb. 8 30° C B Q 3 4 Draw the free-body diagram needed to determine the range of values of P for which both cables remain taut.arrow_forwardCable AB is 103 ft long and the tension in the cable is 3900 lb. 56 ft A 50° 20° B x C Identify the angles 0.0, and 8, that define the direction of force. 1 By N 2 Match each of the options above to the items below. 142.1° 57.1° 73.3° 3 8.arrow_forwardIn the given figure, P = 51 lb . 65° C 25° 35° 75 lb P Determine the corresponding magnitude of the resultant. The corresponding magnitude of the resultant is| lb.arrow_forward
- Cable AB is 103 ft long and the tension in the cable is 3900 lb. 56 ft D y A B 20° 50° x C Identify the x, y, and z components of the force exerted by the cable on the anchor B. 1 F. FI 3 Fy 2 Match each of the options above to the items below. 2,120 lb 1,120 lb -3,076 lbarrow_forwardIn the given figure, P = 51 lb. 65° 25° 35° 75 lb P B Determine the required tension in cable AC, knowing that the resultant of the three forces exerted at point C of boom BC must be directed along BC. The required tension in cable AC is lb.arrow_forwardhelp on this question about Laplace transformation?arrow_forward
- Help me expand this fraction below.arrow_forwarddetermine the final and initial value of the expression below: Helparrow_forwardThe boom OA carries a load P and is supported by two cables as shown. Knowing that the tension in cable AB is 190 lb and that the resultant of the load P and of the forces exerted at A by the two cables must be directed along OA, determine the tension in cable AC. 29 in. B 24 in. 36 in. C 25 in. 48 in.. Aarrow_forward
- Find the distance (d) from the point (8, -7, -1) to the plane 3x+5y-3z = -60.arrow_forwardThe 60-lb collar A can slide on a frictionless vertical rod and is connected as shown to a 65-lb counterweight C. Draw the free-body diagram of the collar that is needed to determine the value of h for which the system is in equilibrium. -15 in. A 60 lb B C h 65 lbarrow_forwardTwo cables tied together at Care loaded as shown. Given: Q = 130 lb. 30° C B Determine the range of values of P for which both cables remain taut. lbarrow_forwardarrow_back_iosSEE MORE QUESTIONSarrow_forward_ios
 Calculus: Early TranscendentalsCalculusISBN:9781285741550Author:James StewartPublisher:Cengage Learning
 Thomas' Calculus (14th Edition)CalculusISBN:9780134438986Author:Joel R. Hass, Christopher E. Heil, Maurice D. WeirPublisher:PEARSON
 Calculus: Early Transcendentals (3rd Edition)CalculusISBN:9780134763644Author:William L. Briggs, Lyle Cochran, Bernard Gillett, Eric SchulzPublisher:PEARSON
 Calculus: Early TranscendentalsCalculusISBN:9781319050740Author:Jon Rogawski, Colin Adams, Robert FranzosaPublisher:W. H. Freeman
 Calculus: Early Transcendental FunctionsCalculusISBN:9781337552516Author:Ron Larson, Bruce H. EdwardsPublisher:Cengage Learning