
Videos
To find : all the solutions of the equations in the given interval
Answer to Problem 75E
The solution to the
Explanation of Solution
Given information:
Concept Involved:
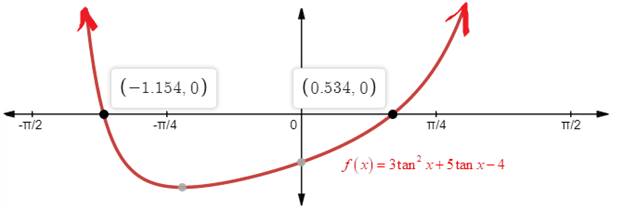
Solution to a quadratic equation are the values of x that makes the equation TRUE. To solve a trigonometric equation using graphing utility, we need identify the function to be graphed by setting up the left side of the equation to zero, then graph the function to see where the function cuts the x-axis.
Graph:
Interpretation:
Graphing the function
Conclusion:
Chapter 5 Solutions
EBK PRECALCULUS W/LIMITS


- Let m(t) be a continuous function with a domain of all real numbers. The table below shows some of the values of m(t) . Assume the characteristics of this function are represented in the table. t -3 -2 8 11 12 m(t) -7 6 3 -9 0 (a) The point (-3, -7) is on the graph of m(t). Find the corresponding point on the graph of the transformation y = -m(t) + 17. (b) The point (8, 3) is on the graph of m(t). Find the corresponding point on the graph of the transformation y = -m (−t) . 24 (c) Find f(12), if we know that f(t) = |m (t − 1)| f(12) =arrow_forwardUse the method of washers to find the volume of the solid that is obtained when the region between the graphs f(x) = √√2 and g(x) = secx over the interval ≤x≤ is rotated about the x-axis.arrow_forward5 Use the method of disks to find the volume of the solid that is obtained when the region under the curve y = over the interval [4,17] is rotated about the x-axis.arrow_forward
- 3. Use the method of washers to find the volume of the solid that is obtained when the region between the graphs f(x) = √√2 and g(x) = secx over the interval ≤x≤ is rotated about the x-axis.arrow_forward4. Use cylindrical shells to find the volume of the solid generated when the region enclosed by the given curves is revolved about the x-axis. y = √√x, y = 0, y = √√3arrow_forward5 4 3 21 N -5-4-3-2 -1 -2 -3 -4 1 2 3 4 5 -5+ Write an equation for the function graphed above y =arrow_forward
- 6 5 4 3 2 1 -5 -4-3-2-1 1 5 6 -1 23 -2 -3 -4 -5 The graph above is a transformation of the function f(x) = |x| Write an equation for the function graphed above g(x) =arrow_forwardThe graph of y x² is shown on the grid. Graph y = = (x+3)² – 1. +10+ 69 8 7 5 4 9 432 6. 7 8 9 10 1 10 -9 -8 -7 -6 -5 -4 -3 -2 -1 1 2 3 4 5 -2 -3 -4 -5 -6- Clear All Draw:arrow_forwardSketch a graph of f(x) = 2(x − 2)² − 3 4 3 2 1 5 ས་ -5 -4 -3 -2 -1 1 2 3 4 -1 -2 -3 -4 -5+ Clear All Draw:arrow_forward
- 5. Find the arc length of the curve y = 3x³/2 from x = 0 to x = 4.arrow_forward-6 -5 * 10 8 6 4 2 -2 -1 -2 1 2 3 4 5 6 -6 -8 -10- The function graphed above is: Concave up on the interval(s) Concave down on the interval(s) There is an inflection point at:arrow_forward6 5 4 3 2 1 -6 -5 -3 -2 3 -1 -2 -3 -4 -5 The graph above is a transformation of the function x² Write an equation for the function graphed above g(x) =arrow_forward
 Calculus: Early TranscendentalsCalculusISBN:9781285741550Author:James StewartPublisher:Cengage Learning
 Thomas' Calculus (14th Edition)CalculusISBN:9780134438986Author:Joel R. Hass, Christopher E. Heil, Maurice D. WeirPublisher:PEARSON
 Calculus: Early Transcendentals (3rd Edition)CalculusISBN:9780134763644Author:William L. Briggs, Lyle Cochran, Bernard Gillett, Eric SchulzPublisher:PEARSON
 Calculus: Early TranscendentalsCalculusISBN:9781319050740Author:Jon Rogawski, Colin Adams, Robert FranzosaPublisher:W. H. Freeman
 Calculus: Early Transcendental FunctionsCalculusISBN:9781337552516Author:Ron Larson, Bruce H. EdwardsPublisher:Cengage Learning