
Concept explainers
Videos
(a)
(a)
Answer to Problem 61E
Probability for the child from England prefers Telepathy,
Explanation of Solution
Given information:
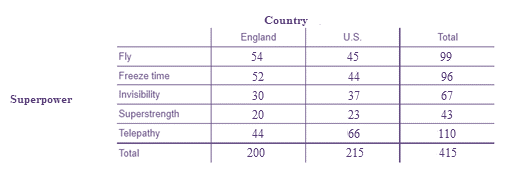
Data for superpowers in the two − way table:
According to conditional probability,
We know
E: England
T: Telepathy
Note that
The information about 415 children is provided in the table.
Thus,
The number of possible outcomes is 415.
Also note that
In the table, 200 of the 415 children are from England.
Thus,
The number of favorable outcomes is 200.
When the number of favorable outcomes is divided by the number of possible outcomes, we get the probability.
Now,
Note that
In the table, 44 of the 415 children are from England and prefer Telepathy. In this case, the number of favorable outcomes is 44 and number of possible outcomes is 415.
Apply conditional probability:
Therefore,
Around 22% of the children from England prefer Telepathy and the probability for the child from England prefers Telepathy is 0.22.
(b)
Probability for the child from England did not choose superstrength.
(b)
Answer to Problem 61E
Probability that the child from England did not choose superstrength,
Explanation of Solution
Given information:
Data for superpowers in the two − way table:

According to complement rule,
According to conditional probability,
We know
E: England
S: Superstrength
Note that
The information about 415 children is provided in the table.
Thus,
The number of possible outcomes is 415.
Also note that
In the table, 43 of the 415 children from both the countries prefer superstrength.
Thus,
The number of favorable outcomes is 43.
When the number of favorable outcomes is divided by the number of possible outcomes, we get the probability.
Apply complement rule:
Now,
Note that
In the table, 20 children from total 200 children from England prefer Superstrength.
That means
Remaining 180 children from total 200 children from England do not prefer Superstrength.
In this case, the number of favorable outcomes is 180.
Since the total children from both the countries are 415.
Thus,
The number of possible outcomes is 415.
Apply conditional probability:
Therefore,
Around 48.39% children not preferring Superstrength are from England and the probability for child from England did not prefer Superstrength is 0.4839.
Chapter 5 Solutions
PRACTICE OF STATISTICS F/AP EXAM
Additional Math Textbook Solutions
Thinking Mathematically (6th Edition)
Algebra and Trigonometry (6th Edition)
Intro Stats, Books a la Carte Edition (5th Edition)
Introductory Statistics
Calculus for Business, Economics, Life Sciences, and Social Sciences (14th Edition)


- A marketing agency wants to determine whether different advertising platforms generate significantly different levels of customer engagement. The agency measures the average number of daily clicks on ads for three platforms: Social Media, Search Engines, and Email Campaigns. The agency collects data on daily clicks for each platform over a 10-day period and wants to test whether there is a statistically significant difference in the mean number of daily clicks among these platforms. Conduct ANOVA test. You can provide your answer by inserting a text box and the answer must include: also please provide a step by on getting the answers in excel Null hypothesis, Alternative hypothesis, Show answer (output table/summary table), and Conclusion based on the P value.arrow_forwardA company found that the daily sales revenue of its flagship product follows a normal distribution with a mean of $4500 and a standard deviation of $450. The company defines a "high-sales day" that is, any day with sales exceeding $4800. please provide a step by step on how to get the answers Q: What percentage of days can the company expect to have "high-sales days" or sales greater than $4800? Q: What is the sales revenue threshold for the bottom 10% of days? (please note that 10% refers to the probability/area under bell curve towards the lower tail of bell curve) Provide answers in the yellow cellsarrow_forwardBusiness Discussarrow_forward
 MATLAB: An Introduction with ApplicationsStatisticsISBN:9781119256830Author:Amos GilatPublisher:John Wiley & Sons Inc
 Probability and Statistics for Engineering and th...StatisticsISBN:9781305251809Author:Jay L. DevorePublisher:Cengage Learning
 Statistics for The Behavioral Sciences (MindTap C...StatisticsISBN:9781305504912Author:Frederick J Gravetter, Larry B. WallnauPublisher:Cengage Learning
 Elementary Statistics: Picturing the World (7th E...StatisticsISBN:9780134683416Author:Ron Larson, Betsy FarberPublisher:PEARSON
 The Basic Practice of StatisticsStatisticsISBN:9781319042578Author:David S. Moore, William I. Notz, Michael A. FlignerPublisher:W. H. Freeman
 Introduction to the Practice of StatisticsStatisticsISBN:9781319013387Author:David S. Moore, George P. McCabe, Bruce A. CraigPublisher:W. H. Freeman