
Concept explainers
Videos
(a)
To Explain: the few sentences comparing this distribution.
(a)
Explanation of Solution
Given:
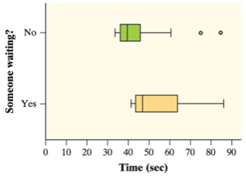
People who had to wait longer, more often answered “Yes” , because the box of the box plot for ”Yes” lies greater than the box of the box plot for “No”.
The data for the “No” answered contained two outliers; the reason is that there are two dots above the box plot.
The time seems to be right-skewed, because most times take on low values (40 to 50 seconds).
The spread for the “Yes” answers is more than for the “No” an answer, the reason is that the distance between the whiskers for the “Yes” box plot is bigger.
(b)
To Explain: the conclusion which is having someone waiting causes drivers to leave their spaces more slowly.
(b)
Answer to Problem 30E
Yes
Explanation of Solution
Given:

Yes, because the box plot for when somebody was waiting (“Yes”) lies greater than the box plot for when somebody was not waiting (“No”).
This is also normal, because if there is somebody waiting then it requires taking into account the distance to the waiting vehicle. Such that you do not hit the waiting vehicle.
Chapter 5 Solutions
PRACTICE OF STATISTICS F/AP EXAM
Additional Math Textbook Solutions
Elementary Statistics (13th Edition)
University Calculus: Early Transcendentals (4th Edition)
Elementary Statistics
Elementary Statistics: Picturing the World (7th Edition)
Intro Stats, Books a la Carte Edition (5th Edition)
Algebra and Trigonometry (6th Edition)


- A marketing agency wants to determine whether different advertising platforms generate significantly different levels of customer engagement. The agency measures the average number of daily clicks on ads for three platforms: Social Media, Search Engines, and Email Campaigns. The agency collects data on daily clicks for each platform over a 10-day period and wants to test whether there is a statistically significant difference in the mean number of daily clicks among these platforms. Conduct ANOVA test. You can provide your answer by inserting a text box and the answer must include: also please provide a step by on getting the answers in excel Null hypothesis, Alternative hypothesis, Show answer (output table/summary table), and Conclusion based on the P value.arrow_forwardA company found that the daily sales revenue of its flagship product follows a normal distribution with a mean of $4500 and a standard deviation of $450. The company defines a "high-sales day" that is, any day with sales exceeding $4800. please provide a step by step on how to get the answers Q: What percentage of days can the company expect to have "high-sales days" or sales greater than $4800? Q: What is the sales revenue threshold for the bottom 10% of days? (please note that 10% refers to the probability/area under bell curve towards the lower tail of bell curve) Provide answers in the yellow cellsarrow_forwardBusiness Discussarrow_forward
 MATLAB: An Introduction with ApplicationsStatisticsISBN:9781119256830Author:Amos GilatPublisher:John Wiley & Sons Inc
 Probability and Statistics for Engineering and th...StatisticsISBN:9781305251809Author:Jay L. DevorePublisher:Cengage Learning
 Statistics for The Behavioral Sciences (MindTap C...StatisticsISBN:9781305504912Author:Frederick J Gravetter, Larry B. WallnauPublisher:Cengage Learning
 Elementary Statistics: Picturing the World (7th E...StatisticsISBN:9780134683416Author:Ron Larson, Betsy FarberPublisher:PEARSON
 The Basic Practice of StatisticsStatisticsISBN:9781319042578Author:David S. Moore, William I. Notz, Michael A. FlignerPublisher:W. H. Freeman
 Introduction to the Practice of StatisticsStatisticsISBN:9781319013387Author:David S. Moore, George P. McCabe, Bruce A. CraigPublisher:W. H. Freeman