
Concept explainers
Videos
(a)
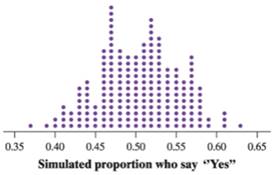
To Explain: the reason of sample outcomes 55 out of 100 said “Yes” does not allow convincing proof that more than half of the school’ student recycle.
(a)
Answer to Problem 21E
Dot plot is having many points above the sample proportion of 0.55
Explanation of Solution
Given:
55 outcomes from 100 students said “Yes”
By seeing the dot plot, it is notice that the proportion of 0.55 has many dots above it. Therefore it is too much likely to get a proportion of 0.55 if the true proportion is 0.5 and then there is not enough proof to help the claim that more than half of the school’s students recycle.
(b)
To Explain: the reason of result would offer convincing proof that a majority of the school’s students recycle if 60 students in the class’s sample had said “Yes”.
(b)
Answer to Problem 21E
There is only one dot plot above the 0.63 and no contained dots to the right of 0.63 in the plot.
Explanation of Solution
Given:

55 outcomes from 100 students said “Yes”
By seeing the dot plot, it is observed that the proportion of 0.63 has only one dot above it and there is no contained the dot plot to the right of 0.63, therefore is too much likely to get a proportion of 0.63 if the true proportion is 0.5 and then there is enough proof to help the claim that more than half of the school’s students recycle.
Chapter 5 Solutions
PRACTICE OF STATISTICS F/AP EXAM
Additional Math Textbook Solutions
Pre-Algebra Student Edition
Introductory Statistics
University Calculus: Early Transcendentals (4th Edition)
College Algebra with Modeling & Visualization (5th Edition)
Calculus: Early Transcendentals (2nd Edition)


- Find the critical value for a left-tailed test using the F distribution with a 0.025, degrees of freedom in the numerator=12, and degrees of freedom in the denominator = 50. A portion of the table of critical values of the F-distribution is provided. Click the icon to view the partial table of critical values of the F-distribution. What is the critical value? (Round to two decimal places as needed.)arrow_forwardA retail store manager claims that the average daily sales of the store are $1,500. You aim to test whether the actual average daily sales differ significantly from this claimed value. You can provide your answer by inserting a text box and the answer must include: Null hypothesis, Alternative hypothesis, Show answer (output table/summary table), and Conclusion based on the P value. Showing the calculation is a must. If calculation is missing,so please provide a step by step on the answers Numerical answers in the yellow cellsarrow_forwardShow all workarrow_forward
- Show all workarrow_forwardplease find the answers for the yellows boxes using the information and the picture belowarrow_forwardA marketing agency wants to determine whether different advertising platforms generate significantly different levels of customer engagement. The agency measures the average number of daily clicks on ads for three platforms: Social Media, Search Engines, and Email Campaigns. The agency collects data on daily clicks for each platform over a 10-day period and wants to test whether there is a statistically significant difference in the mean number of daily clicks among these platforms. Conduct ANOVA test. You can provide your answer by inserting a text box and the answer must include: also please provide a step by on getting the answers in excel Null hypothesis, Alternative hypothesis, Show answer (output table/summary table), and Conclusion based on the P value.arrow_forward
 MATLAB: An Introduction with ApplicationsStatisticsISBN:9781119256830Author:Amos GilatPublisher:John Wiley & Sons Inc
 Probability and Statistics for Engineering and th...StatisticsISBN:9781305251809Author:Jay L. DevorePublisher:Cengage Learning
 Statistics for The Behavioral Sciences (MindTap C...StatisticsISBN:9781305504912Author:Frederick J Gravetter, Larry B. WallnauPublisher:Cengage Learning
 Elementary Statistics: Picturing the World (7th E...StatisticsISBN:9780134683416Author:Ron Larson, Betsy FarberPublisher:PEARSON
 The Basic Practice of StatisticsStatisticsISBN:9781319042578Author:David S. Moore, William I. Notz, Michael A. FlignerPublisher:W. H. Freeman
 Introduction to the Practice of StatisticsStatisticsISBN:9781319013387Author:David S. Moore, George P. McCabe, Bruce A. CraigPublisher:W. H. Freeman