
Videos
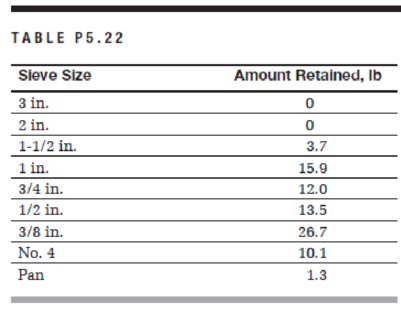
A sieve analysis test was performed on a sample of coarse aggregate and produced the results in Table P5.22.
a. Calculate the percent passing through each sieve.
b. What is the maximum size?
c. What is the nominal maximum size?
d. Plot the percent passing versus sieve size on a semilog gradation chart.
e. Plot the percent passing versus sieve size on a 0.45 gradation chart (Figure A.25).
f. Referring to Table 5.5 (ASTM C33), what is the closest size number and does it meet the gradation for that standard size?

Learn your wayIncludes step-by-step video

Chapter 5 Solutions
Materials for Civil and Construction Engineers (4th Edition)
Additional Engineering Textbook Solutions
Foundation Design: Principles and Practices (3rd Edition)
Statics and Mechanics of Materials (5th Edition)
Automotive Technology: Principles, Diagnosis, and Service (5th Edition)
Starting Out with C++ from Control Structures to Objects (8th Edition)
Thinking Like an Engineer: An Active Learning Approach (3rd Edition)
Computer Science: An Overview (12th Edition)


- please answer in the nearest 3 decimal number. refer to MM = 07 and DD as 26arrow_forwardReferring to the aggregate gradations A, B, and C in Figure P5.26, answer the following questions: a. What is the maximum size of each gradation? b. What is the nominal maximum size of each gradation? c. Classify each gradation as dense, open, or gap indicating the reason for each classification. 100 A 80- 60 40 0.075 0.30 1.18 2.36 4.75 9.5 12.5 19.0 25.0 0.15 0.60 Sieve sizes (mm) FIGURE P5.26 Percent passing 20arrow_forwardn=2arrow_forward
- a. For an aggregate sample, if you know that the apparent relative density is 2.72 and the water absorption is 1.2%. The dry mass of the aggregate is 514 gm. Find the bulk and saturated surface dry (SSD) relative density values? b. Why does the maximum size of aggregate depend on the clear spacing between bars? Show with a simple sketch. Note: Please answer both a and b... Please answer the both questions.. I don't want single b answer.. thank youarrow_forwardSieve analysis test for fine aggregates was performed on a sample of fine aggregates and produced the following results: a. Calculate the percent passing through each sieve. b. Plot the percent finer in a semi-log gradation chart. c. What is the maximum aggregate size of the sample? d. What is the nominal maximum aggregate size of the sample? e. What is the fineness modulus? Is it in typical range? " Sieve Size, 9.5 4.75 3.35 2.36 2.00 1.18 0.85 0.60 0.425 0.30 0.25 0.18 0.15 (No. 0.075 Pan mm (in) (3/8) (No. 4) (No. 6) (No. 8) (No. 10) (No. 16) (No. 20) (No. 30) (No. 40) (No. 50) (No. 60) (No. 80) 100) (No. 200)| Amount 25 59 75 86 115 136 169 192 225 198 173 112 90 33 12 Datained.arrow_forwardSieve analysis test for fine aggregates was performed on a sample of fine aggregates and produced the following results: a. Calculate the percent passing through each sieve.b. Plot the percent finer in a semi-log gradation chart.c. What is the maximum aggregate size of the sample?d. What is the nominal maximum aggregate size of the sample?e. What is the fineness modulus? Is it in typical range?arrow_forward
- 26 - please show complete solution, thanks!arrow_forwardIn a ready-mix plant, cylindrical samples are prepared and tested periodically to detect any mix problem and to ensure that the compressive strength is higher than the lower specification limit. The minimum target value was set at 5,000 psi. The compressive strength data shown in Table were collected. a. Calculate the mean, standard deviation, and the coefficient of variation of the data. b. Using a spreadsheet program, create a control chart for these data showing the lower specification limit. Is the plant production meeting the specification requirement? If not, comment on possible reasons. Comment on the data scatter.arrow_forwardSieve analysis test for fine aggregates was performed on a sample of fine aggregates and produced the following results: a. Calculate the percent passing through each sieve. b. Plot the percent finer in a semi-log gradation chart. c. What is the maximum aggregate size of the sample? d. What is the nominal maximum aggregate size of the sample? e. What is the fineness modulus? Is it in typical range? Sieve Size, 9.5 4.75 3.35 2.36 2.00 1.18 0.85 0.60 0.425 0.30 0.25 0.18 0.15 (No. 0.075 Pan mm (in) (3/8) (No. 4)(No. 6) (No. 8) (No. 10) (No. 16) (No. 20)|(No. 30) (No. 40)|(No. 50)|(No. 60) (No. 80) 100) |(No. 200) Amount 25 59 75 86 115 136 169 192 225 198 173 112 90 33 12 Retained, garrow_forward
- Sieve analysis test for fine aggregates was performed on a sample of fine aggregates and produced the following results: a. Calculate the percent passing through each sieve. b. Plot the percent finer in a semi-log gradation chart. c. What is the maximum aggregate size of the sample? d. What is the nominal maximum aggregate size of the sample? e. What is the fineness modulus? Is it in typical range? 0.18 0.15 (No. (3/8) INo. 41 (INo. 6) (No. 8)|(No. 10) (No. 16) (No. 20)|INo. 30)|(No. 40)|(No. So) (No. 60)|(No. 80) 100) Sieve Size, 9.5 4.75 3.35 2.36 2.00 1.18 0.85 0.60 0.425 0.30 0.25 0.075 Pan mm (in) (No. 200) Amount 25 59 75 86 115 136 169 192 225 198 173 112 90 33 12 Retained,arrow_forwardA sieve analysis test was performed on a sample of fine aggregate and produced the results in Table below. Calculate the percent passing through each sieve. What is the maximum size? What is the nominal maximum size? What is the Fineness Modulus? Plot the percent passing versus sieve size on a semi-log gradation size. (You can use Excel sheets or you can draw on a semi-log attached to page 3 of this assignment) Sieve size (mm) Amount retained (g) Cumulative amount retained (g) Cumulative percentage retained Percent passing 12.5 0 9.5 21 4.75 104 2.36 79 1.18 78 0.6 51 0.30 78 0.15 82 0.075 39 pan 5arrow_forwardTesting Procedure for Unit Weight of Aggregate.arrow_forward

 Structural Analysis (10th Edition)Civil EngineeringISBN:9780134610672Author:Russell C. HibbelerPublisher:PEARSON
 Principles of Foundation Engineering (MindTap Cou...Civil EngineeringISBN:9781337705028Author:Braja M. Das, Nagaratnam SivakuganPublisher:Cengage Learning
 Fundamentals of Structural AnalysisCivil EngineeringISBN:9780073398006Author:Kenneth M. Leet Emeritus, Chia-Ming Uang, Joel LanningPublisher:McGraw-Hill Education
 Traffic and Highway EngineeringCivil EngineeringISBN:9781305156241Author:Garber, Nicholas J.Publisher:Cengage Learning