SAT Scores by Income The following bar graph shows U.S. critical reading SAT scores as a function of household income. 52 Family income ($1,000) a. Which of the following best models the data ( C is a constant)? (A) S ( x ) = C + 1 136 e 0.015 x (B) S ( x ) = C − 136 e 0.015 x (C) S ( x ) = C − 136 e 0.015 x (D) S ( x ) = C − e 0.015 x 136 ( S ( x ) is the average math SAT score of students whose household income in x thousand dollars per year.) b. Use S ' ( x ) topredict how a student’s math SAT score is affected by a $ 1 , 000 increasein parents’ income for a student whose parents earn $45,000. c. Does S ' ( x ) increasesor decreases as x increases? Interpret your answer.
SAT Scores by Income The following bar graph shows U.S. critical reading SAT scores as a function of household income. 52 Family income ($1,000) a. Which of the following best models the data ( C is a constant)? (A) S ( x ) = C + 1 136 e 0.015 x (B) S ( x ) = C − 136 e 0.015 x (C) S ( x ) = C − 136 e 0.015 x (D) S ( x ) = C − e 0.015 x 136 ( S ( x ) is the average math SAT score of students whose household income in x thousand dollars per year.) b. Use S ' ( x ) topredict how a student’s math SAT score is affected by a $ 1 , 000 increasein parents’ income for a student whose parents earn $45,000. c. Does S ' ( x ) increasesor decreases as x increases? Interpret your answer.
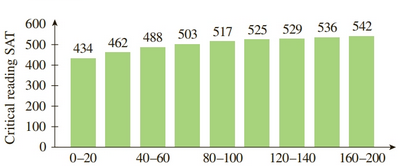
Solution Summary: The author analyzes how the graph shows the critical reading SAT scores as a function of household income.
SAT Scores by Income The following bar graph shows U.S. critical reading SAT scores as a function of household income.52
Family income ($1,000)
a. Which of the following best models the data (C is a constant)?
(A)
S
(
x
)
=
C
+
1
136
e
0.015
x
(B)
S
(
x
)
=
C
−
136
e
0.015
x
(C)
S
(
x
)
=
C
−
136
e
0.015
x
(D)
S
(
x
)
=
C
−
e
0.015
x
136
(
S
(
x
)
is the average math SAT score of students whose household income in x thousand dollars per year.)
b. Use
S
'
(
x
)
topredict how a student’s math SAT score is affected by a
$
1
,
000
increasein parents’ income for a student whose parents earn $45,000.
c. Does
S
'
(
x
)
increasesor decreases as x increases? Interpret your answer.
Find a plane containing the point (3, -3, 1) and the line of intersection of the planes 2x + 3y - 3z = 14
and -3x - y + z = −21.
The equation of the plane is:
Determine whether the lines
L₁ : F(t) = (−2, 3, −1)t + (0,2,-3) and
L2 : ƒ(s) = (2, −3, 1)s + (−10, 17, -8)
intersect. If they do, find the point of intersection.
● They intersect at the point
They are skew lines
They are parallel or equal
Answer questions 2
Chapter 4 Solutions
Student Solutions Manual for Waner/Costenoble's Applied Calculus, 7th
Need a deep-dive on the concept behind this application? Look no further. Learn more about this topic, calculus and related others by exploring similar questions and additional content below.
Correlation Vs Regression: Difference Between them with definition & Comparison Chart; Author: Key Differences;https://www.youtube.com/watch?v=Ou2QGSJVd0U;License: Standard YouTube License, CC-BY
Correlation and Regression: Concepts with Illustrative examples; Author: LEARN & APPLY : Lean and Six Sigma;https://www.youtube.com/watch?v=xTpHD5WLuoA;License: Standard YouTube License, CC-BY


 College AlgebraAlgebraISBN:9781305115545Author:James Stewart, Lothar Redlin, Saleem WatsonPublisher:Cengage Learning
 Functions and Change: A Modeling Approach to Coll...AlgebraISBN:9781337111348Author:Bruce Crauder, Benny Evans, Alan NoellPublisher:Cengage Learning
 Algebra & Trigonometry with Analytic GeometryAlgebraISBN:9781133382119Author:SwokowskiPublisher:Cengage
 Algebra and Trigonometry (MindTap Course List)AlgebraISBN:9781305071742Author:James Stewart, Lothar Redlin, Saleem WatsonPublisher:Cengage Learning
 Glencoe Algebra 1, Student Edition, 9780079039897...AlgebraISBN:9780079039897Author:CarterPublisher:McGraw Hill