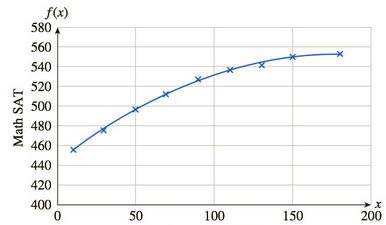
SAT Scores by Income The following graph shown U.S. math SAT scores as a function of parents’ income level. Income ($1,000) The regression curve shown in given by f ( x ) = − 0.0034 x 2 + 1.2 x + 444 ( 10 ≤ x ≤ 180 ) , where f ( x ) is the average math SAT score of a student whose parents earn x thousand dollars per year. a. Find f ' ( x ) , and use your formula to compute f ' ( 100 ) , stating its units of measurement. What does the answer say about math SAT scores? b. Is f ' ( x ) increasingor decreasing with increasing x ? What does your answer say about math SAT scores? [ HINT: See Example 4.]
SAT Scores by Income The following graph shown U.S. math SAT scores as a function of parents’ income level. Income ($1,000) The regression curve shown in given by f ( x ) = − 0.0034 x 2 + 1.2 x + 444 ( 10 ≤ x ≤ 180 ) , where f ( x ) is the average math SAT score of a student whose parents earn x thousand dollars per year. a. Find f ' ( x ) , and use your formula to compute f ' ( 100 ) , stating its units of measurement. What does the answer say about math SAT scores? b. Is f ' ( x ) increasingor decreasing with increasing x ? What does your answer say about math SAT scores? [ HINT: See Example 4.]
Solution Summary: The author calculates the derivatives f'(x) and
SAT Scores by Income The following graph shown U.S. math SAT scores as a function of parents’ income level.
Income ($1,000)
The regression curve shown in given by
f
(
x
)
=
−
0.0034
x
2
+
1.2
x
+
444
(
10
≤
x
≤
180
)
,
where
f
(
x
)
is the average math SAT score of a student whose parents earn x thousand dollars per year.
a. Find
f
'
(
x
)
, and use your formula to compute
f
'
(
100
)
, stating its units of measurement. What does the answer say about math SAT scores?
b. Is
f
'
(
x
)
increasingor decreasing with increasing x? What does your answer say about math SAT scores? [HINT: See Example 4.]
Can you answer this question and give step by step and why and how to get it. Can you write it (numerical method)
Can you answer this question and give step by step and why and how to get it. Can you write it (numerical method)
There are three options for investing $1150. The first earns 10% compounded annually, the second earns 10% compounded quarterly, and the third earns 10% compounded continuously. Find equations that model each investment growth and
use a graphing utility to graph each model in the same viewing window over a 20-year period. Use the graph to determine which investment yields the highest return after 20 years. What are the differences in earnings among the three
investment?
STEP 1: The formula for compound interest is
A =
nt
= P(1 + − − ) n²,
where n is the number of compoundings per year, t is the number of years, r is the interest rate, P is the principal, and A is the amount (balance) after t years. For continuous compounding, the formula reduces to
A = Pert
Find r and n for each model, and use these values to write A in terms of t for each case.
Annual Model
r=0.10
A = Y(t) = 1150 (1.10)*
n = 1
Quarterly Model
r = 0.10
n = 4
A = Q(t) = 1150(1.025) 4t
Continuous Model
r=0.10
A = C(t) =…
Chapter 4 Solutions
Student Solutions Manual for Waner/Costenoble's Applied Calculus, 7th
Need a deep-dive on the concept behind this application? Look no further. Learn more about this topic, calculus and related others by exploring similar questions and additional content below.
Correlation Vs Regression: Difference Between them with definition & Comparison Chart; Author: Key Differences;https://www.youtube.com/watch?v=Ou2QGSJVd0U;License: Standard YouTube License, CC-BY
Correlation and Regression: Concepts with Illustrative examples; Author: LEARN & APPLY : Lean and Six Sigma;https://www.youtube.com/watch?v=xTpHD5WLuoA;License: Standard YouTube License, CC-BY


 Algebra & Trigonometry with Analytic GeometryAlgebraISBN:9781133382119Author:SwokowskiPublisher:Cengage
 Algebra and Trigonometry (MindTap Course List)AlgebraISBN:9781305071742Author:James Stewart, Lothar Redlin, Saleem WatsonPublisher:Cengage Learning
 Glencoe Algebra 1, Student Edition, 9780079039897...AlgebraISBN:9780079039897Author:CarterPublisher:McGraw Hill
 Functions and Change: A Modeling Approach to Coll...AlgebraISBN:9781337111348Author:Bruce Crauder, Benny Evans, Alan NoellPublisher:Cengage Learning
