Existing Home Sales Leading to the Financial Crisis The following graph shows the approximate value of home prices and existing home sales in 2004–2007 (the 3 years prior to the 2008 economic crisis) as a percentage change from 2003, together with quadratic approximations: Home prices and sales of existing homes The quadratic approximations are given by Home prices: P ( t ) = 6 t 2 − 27 t + 10 ( 0 ≤ t ≤ 3 ) Existing home sales: S ( t ) = − 4 t 2 + 4 t + 11 ( 0 ≤ t ≤ 3 ) , where t is time in years since the start of 2004. Use the chain rule to estimate d S d P | t = 2 . What does the answer tell you about home sales and prices? [ HINT: See Quick Examples 6 and 7.]
Existing Home Sales Leading to the Financial Crisis The following graph shows the approximate value of home prices and existing home sales in 2004–2007 (the 3 years prior to the 2008 economic crisis) as a percentage change from 2003, together with quadratic approximations: Home prices and sales of existing homes The quadratic approximations are given by Home prices: P ( t ) = 6 t 2 − 27 t + 10 ( 0 ≤ t ≤ 3 ) Existing home sales: S ( t ) = − 4 t 2 + 4 t + 11 ( 0 ≤ t ≤ 3 ) , where t is time in years since the start of 2004. Use the chain rule to estimate d S d P | t = 2 . What does the answer tell you about home sales and prices? [ HINT: See Quick Examples 6 and 7.]
Solution Summary: The author calculates the derivative of function x and y using chain rule and states, what the answer conveys about home sales and prices.
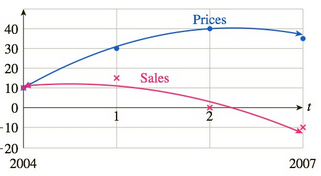
Existing Home Sales Leading to the Financial Crisis The following graph shows the approximate value of home prices and existing home sales in 2004–2007 (the 3 years prior to the 2008 economic crisis) as a percentage change from 2003, together with quadratic approximations:
Home prices and sales of existing homes
The quadratic approximations are given by
Home prices:
P
(
t
)
=
6
t
2
−
27
t
+
10
(
0
≤
t
≤
3
)
Existing home sales:
S
(
t
)
=
−
4
t
2
+
4
t
+
11
(
0
≤
t
≤
3
)
,
where t is time in years since the start of 2004. Use the chain rule to estimate
d
S
d
P
|
t
=
2
. What does the answer tell you about home sales and prices? [HINT: See Quick Examples 6 and 7.]
Can you answer this question and give step by step and why and how to get it. Can you write it (numerical method)
Can you answer this question and give step by step and why and how to get it. Can you write it (numerical method)
There are three options for investing $1150. The first earns 10% compounded annually, the second earns 10% compounded quarterly, and the third earns 10% compounded continuously. Find equations that model each investment growth and
use a graphing utility to graph each model in the same viewing window over a 20-year period. Use the graph to determine which investment yields the highest return after 20 years. What are the differences in earnings among the three
investment?
STEP 1: The formula for compound interest is
A =
nt
= P(1 + − − ) n²,
where n is the number of compoundings per year, t is the number of years, r is the interest rate, P is the principal, and A is the amount (balance) after t years. For continuous compounding, the formula reduces to
A = Pert
Find r and n for each model, and use these values to write A in terms of t for each case.
Annual Model
r=0.10
A = Y(t) = 1150 (1.10)*
n = 1
Quarterly Model
r = 0.10
n = 4
A = Q(t) = 1150(1.025) 4t
Continuous Model
r=0.10
A = C(t) =…
Chapter 4 Solutions
Student Solutions Manual for Waner/Costenoble's Applied Calculus, 7th
Need a deep-dive on the concept behind this application? Look no further. Learn more about this topic, calculus and related others by exploring similar questions and additional content below.


 Algebra & Trigonometry with Analytic GeometryAlgebraISBN:9781133382119Author:SwokowskiPublisher:Cengage
 Algebra and Trigonometry (MindTap Course List)AlgebraISBN:9781305071742Author:James Stewart, Lothar Redlin, Saleem WatsonPublisher:Cengage Learning