
Concept explainers
Videos
The relationship between dependent and independent variable and make a scatter-plot for the given data set.
Answer to Problem 3CYU
The independent variable is the number of years and dependent variable is the median age of females when they are first married. There is
Explanation of Solution
Given:The given data between the number of years and median age of females when they are first married is shown as
| Number of years | Median age of females |
| 1996 | 24.8 |
| 1997 | 25.0 |
| 1998 | 25.0 |
| 1999 | 25.1 |
| 2000 | 25.1 |
| 2001 | 25.1 |
| 2002 | 25.3 |
| 2003 | 25.3 |
| 2005 | 25.5 |
| 2006 | 25.9 |
Graph:The graph for the scatter-plot is shown as,
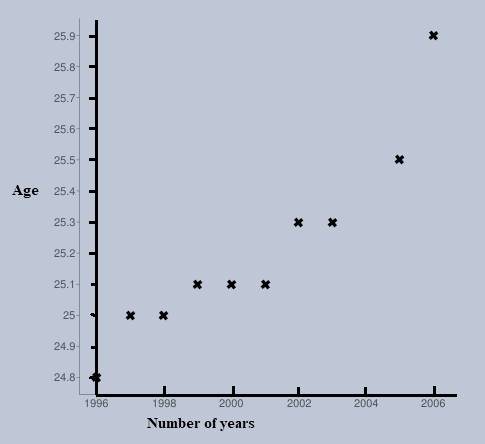
Conclusion:As the number of years increases, the age also increases. Therefore, there is a positive
The graph of line of fit for the
Explanation of Solution
Given: The given data between the number of years and median age of females when they are first married is shown as
| Number of years | Median age of females |
| 1996 | 24.8 |
| 1997 | 25.0 |
| 1998 | 25.0 |
| 1999 | 25.1 |
| 2000 | 25.1 |
| 2001 | 25.1 |
| 2002 | 25.3 |
| 2003 | 25.3 |
| 2005 | 25.5 |
| 2006 | 25.9 |
Graph:The line of fit for the scatter-plot is shown as, where number of years are represented on horizontal axis and median age of females is represented on vertical line.
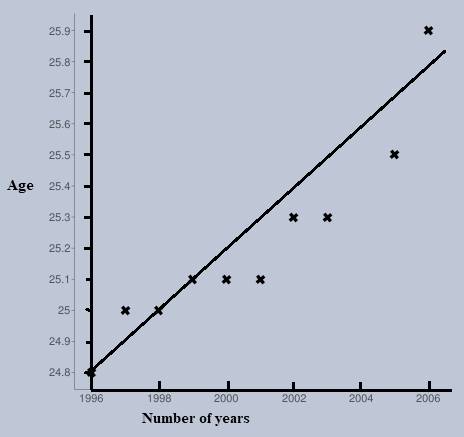
The equation for line of fit in slope intercept form.
Answer to Problem 3CYU
The equation for the line of fit is
Explanation of Solution
Given: The given data between the number of years and median age of females when they are first married is shown as
| Number of years | Median age of females |
| 1996 | 24.8 |
| 1997 | 25.0 |
| 1998 | 25.0 |
| 1999 | 25.1 |
| 2000 | 25.1 |
| 2001 | 25.1 |
| 2002 | 25.3 |
| 2003 | 25.3 |
| 2005 | 25.5 |
| 2006 | 25.9 |
Calculation: The slope
Now, the line of fit having slope
The median age of females when they are first married in 2016.
Answer to Problem 3CYU
The median age of females will be 27 years.
Explanation of Solution
Given: The given data between the number of years and median age of females when they are first married is shown as
| Number of years | Median age of females |
| 1996 | 24.8 |
| 1997 | 25.0 |
| 1998 | 25.0 |
| 1999 | 25.1 |
| 2000 | 25.1 |
| 2001 | 25.1 |
| 2002 | 25.3 |
| 2003 | 25.3 |
| 2005 | 25.5 |
| 2006 | 25.9 |
Calculation: The median age of females in 2016 can be evaluated by plugging
Can the equation of fit give the reasonable estimate for the year 2056? Explain.
Answer to Problem 3CYU
Yes, the equation gives the reasonable estimate for the year 2056 because for the year 2056 the estimated age is 31.4 years.
Explanation of Solution
Given: The given data between the number of years and median age of females when they are first married is shown as
| Number of years | Median age of females |
| 1996 | 24.8 |
| 1997 | 25.0 |
| 1998 | 25.0 |
| 1999 | 25.1 |
| 2000 | 25.1 |
| 2001 | 25.1 |
| 2002 | 25.3 |
| 2003 | 25.3 |
| 2005 | 25.5 |
| 2006 | 25.9 |
Calculation: The median age of females in 2056 can be evaluated by plugging
Hence, the equation of fit gives a reasonable estimate for the year 2056 because in the year 2056 the predicted age of women comes 31.4 years.
Chapter 4 Solutions
Algebra 1
Additional Math Textbook Solutions
University Calculus: Early Transcendentals (4th Edition)
Thinking Mathematically (6th Edition)
Algebra and Trigonometry (6th Edition)
A Problem Solving Approach To Mathematics For Elementary School Teachers (13th Edition)
College Algebra with Modeling & Visualization (5th Edition)


- Solve the following system of equations: 50x+20y=1800 10x+3y=300arrow_forward> > > we are hiring Salesforce Admin Location: Remote Key Responsibilities: Administer Salesforce Sales & Revenue Cloud (CPQ & Billing) Configure workflows, validation rules & dashboards Automate processes using Flows & Process Builder Collaborate with Sales, Finance & Marketing teams Manage user roles & security Apply: Hr@forcecraver.comarrow_forwardAnswer this questionarrow_forward
- 1. vector projection. Assume, ER1001 and you know the following: ||||=4, 7=-0.5.7. For each of the following, explicitly compute the value. འབ (a) (b) (c) (d) answer. Explicitly compute ||y7||. Explain your answer. Explicitly compute the cosine similarity of and y. Explain your Explicitly compute (x, y). Explain your answer. Find the projection of onto y and the projection of onto .arrow_forward2. Answer the following questions using vectors u and v. --0-0-0 = find the the cosine similarity and the angle between u and v. འརྒྱ (a) (b) find the scalar projection of u onto v. (c) find the projection of u onto v. (d) (e) (f) find the scalar projection of onto u. find the projection of u onto u. find the projection of u onto and the projection of onto . (Hint: find the inner product and verify the orthogonality)arrow_forwardPlease type out answerarrow_forward
- The function f(x) = log x is transformed to produce g(x) = log (x) – 3. Identify the type of transformation and describe the change. Please type out answerarrow_forwardEach graph below is the graph of a system of three linear equations in three unknowns of the form Ax = b. Determine whether each system has a solution and, if it does, the number of free variables. A. O free variables ✓ B. no solution C. no solution D. no solution E. 1 free variable F. 1 free variablearrow_forwardSolve the following systems of equations and show all work.y = x2 + 3y = x + 5 Please type out answerarrow_forward
 Algebra and Trigonometry (6th Edition)AlgebraISBN:9780134463216Author:Robert F. BlitzerPublisher:PEARSON
 Contemporary Abstract AlgebraAlgebraISBN:9781305657960Author:Joseph GallianPublisher:Cengage Learning
 Linear Algebra: A Modern IntroductionAlgebraISBN:9781285463247Author:David PoolePublisher:Cengage Learning
 Algebra And Trigonometry (11th Edition)AlgebraISBN:9780135163078Author:Michael SullivanPublisher:PEARSON
 Introduction to Linear Algebra, Fifth EditionAlgebraISBN:9780980232776Author:Gilbert StrangPublisher:Wellesley-Cambridge Press
 College Algebra (Collegiate Math)AlgebraISBN:9780077836344Author:Julie Miller, Donna GerkenPublisher:McGraw-Hill Education